
ATM is detected as a mutational cancer driver
ATM reports
Gene details
| ATM |
|---|
|
Gene ID
ENSG00000149311
Transcript ID ENST00000675843 Protein ID ENSP00000501606 |
|
Cancer types where is driver
24
Cohorts where is driver 50 Mutated samples 585 Mutations 1,518 |
| Known driver True |
Method signals per Cancer Type
| Cancer type | Methods | Samples | Samples (%) |
|---|
ClustL
HotMAPS
smRegions
Clustered Mutations
CBaSE dNdScv Recurrent Mutations
FML Functional Mutations
MutPanning Tri-nucleotide specific bias
combination Combination
CBaSE dNdScv Recurrent Mutations
FML Functional Mutations
MutPanning Tri-nucleotide specific bias
combination Combination
In-silico saturation mutagenesis
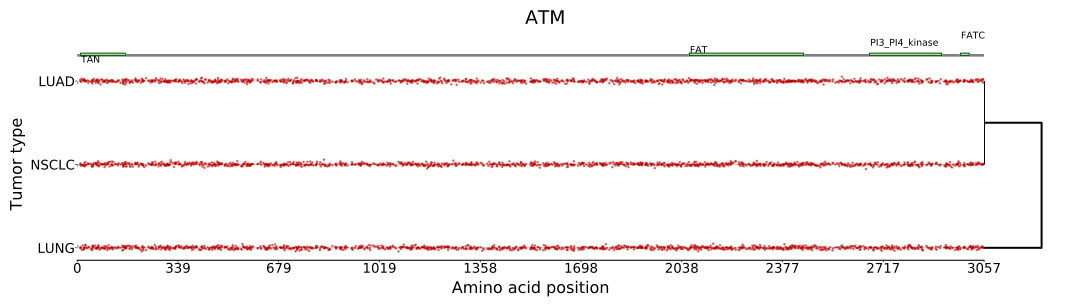
In silico saturation mutagenesis profiles across all tumor types
where a specific model is available.
Driver mutations (displayed as red dots) are mapped to
their positions in the canonical transcript.
The dendrogram on the right represents a hierarchical
clustering of the profiles based on site-by-site
concordance via Matthews Correlation similarity.
The track on the top displays the Pfam domains mapping
to the canonical transcript.
See the FAQs for more details
about the in silico saturation mutagenesis computed
with boostDM.
| Model | Mutations | Driver mutations | Driver mutations (%) |
|---|---|---|---|
| LUAD (Lung Adenocarcinoma) | 36119 | 2547 | 7.05 |
| LUNG (Lung) | 36119 | 10919 | 30.23 |
| NSCLC (Non-Small Cell Lung Cancer) | 36119 | 2547 | 7.05 |
Observed mutations in tumors
The mutations needle plot shows the distribution of the observed
mutations along the protein sequence.
| Mutation (GRCh38) | Protein Position | Samples | Consequence |
|---|