- General Questions
- Usability Questions
General Questions
What is boostDM?
boostDM is a computational method to conduct in silico saturation mutagenesis of cancer genes. Using mutational features, the method scores and classifies all possible single base substitutions in cancer genes by their potential to be involved in tumorigenesis.
How does it work?
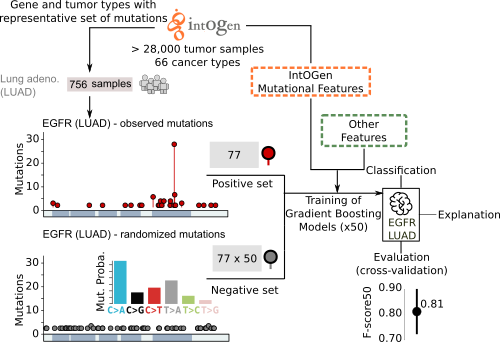
The method is based on the analysis of observed mutations in sequenced tumors and their site-by-site annotation with relevant features. The compendium of cancer genes and the mutational features for each cancer gene across malignancies have been derived from the systematic analysisof tens of thousands of tumor samples (www.intogen.org). Other relevant features have been collected from public databases.
What is the main novelty?
The main novelty of boostDM is that it provides a means to classify any potential somatic mutation sequenced in tumors as a driver or non-driver in a cancer gene and tumor type specific manner. Additionally, it does not require any pre-annotated labeling of driver or passenger mutations. We also aimed to make classification of each possible mutation in a cancer gene readily interpretable. For that purpose, the features used to train the models of each cancer gene are mutational patterns that are closely connected to the signals of positive selection discerned (IntOGen) across cohorts of tumors.
How does boostDM training work?
boostDM resorts to a supervised learning approach that exploits a training dataset made of "driver" and "passenger" mutations from a cancer gene. By means of dN/dS analysis (dNdScv), we can establish a proportion of mutations observed that cannot be explained by neutral evolution (excess). To train boostDM, we include in the "driver" training set all the mutations observed in cancer driver genes (IntOGen) with high enough excess mutations over expected per consequence type (≥ 85%), implying that we include as positive examples only those mutations with consequence types showing high excess. On the other hand, the "non-driver" training set are mutations randomly drawn with probabilities based on the trinucleotide context rates reported in the tumor type cohort.
What features do the models use?
Each mutation provided for training is annotated with a set of mutational features, which the classification task exploits to discriminate between observed drivers and passengers in tumors. Some mutational features have been derived from the systematic analysis of tens of thousands of tumor samples from IntOGen (e.g., linear clusters, 3D clusters, enriched functional domains). Other relevant features, such as nucleotide conservation or post-translational modifications are collected from public databases of biological sequences. Here we introduce a brief description of the features the user will find in this site. For a more detailed account, please refer to the manuscript.
- SYNONYMOUS, MISSENSE, NONSENSE: whether the mutation induces any of these consequence types at the protein level (ENSEMBL Variant Effect Predictor).
- SPLICE: whether the mutation has the potential to disrupt RNA splicing in the canonical transcript (ENSEMBL Variant Effect Predictor).
- 3C: 3-level ordinal encoding of whether the mutation maps to a mutational cluster in the 3D protein conformation (HotMaps3D) inferred in the same tumor type, in another tumor type, or it does not map any cluster in the entire dataset.
- LC: 3-level ordinal encoding of whether the mutation maps to a linear cluster (oncodriveCLUSTL) inferred in the same tumor type, in another tumor type, or it does not map any cluster in the entire dataset.
- DOM: 3-level ordinal encoding of whether the mutation maps to a Pfam domain that is recurrently mutated in the tumor type (smRegions) inferred in the same tumor type, in another tumor type, or it does not map to any recurrently mutated Pfam domain in the entire dataset.
- PHYLOP: nucleotide conservation score asserted through multiple sequence alignments of 99 vertebrate genomes against the human genome (100-way score).
- NMD: whether the (nonsense) mutation is reported in the first or last exon of the MANE Select transcript, implying higher chances to undergo inefficient nonsense-mediated mRNA decay.
- ACETYLATION, METHYLATION, PHOS (phosphorylation), REG (regulatory site), UB (ubiquitination): whether the mutation maps to a protein site known to undergo post-translational modification (PhosphoSitePlus).
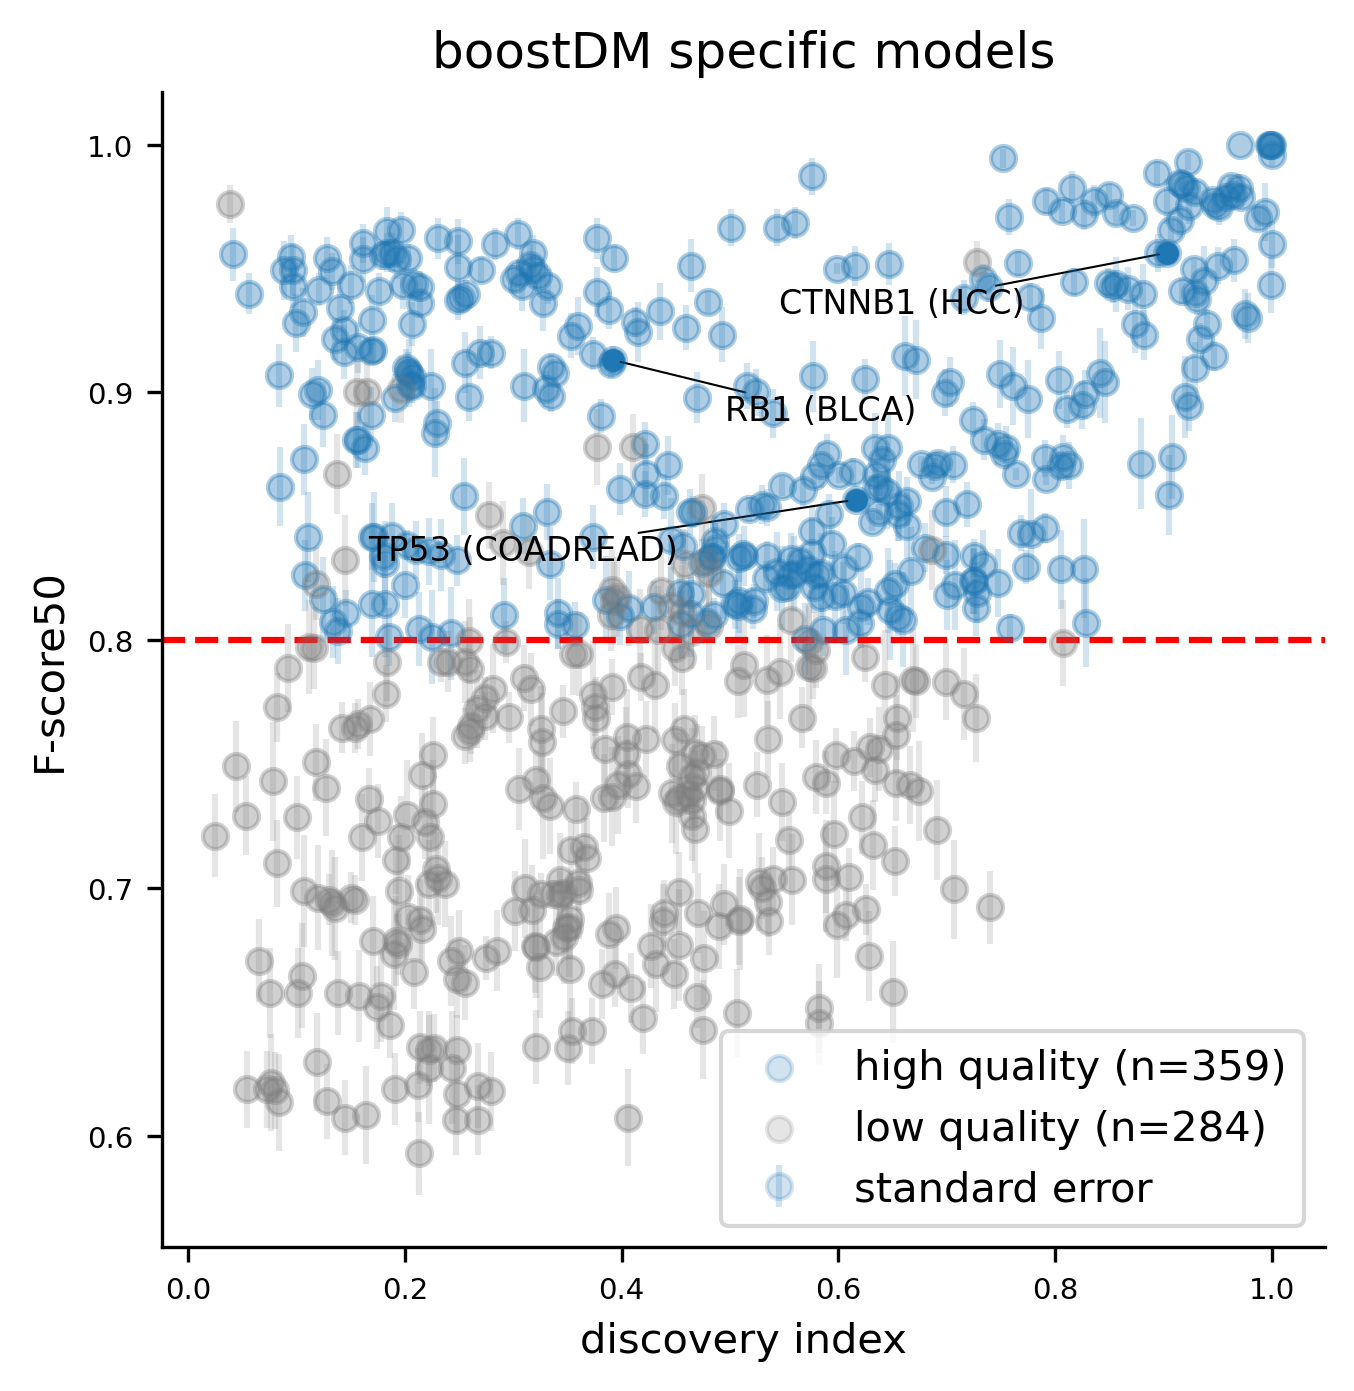
How do you evaluate the quality of the models?
Each model generated by boostDM is realized as the aggregation of a collection of classifiers (base models) trained with random subsets of the training data. In the current version 50 classifiers were trained with random subsets of driver and non-driver mutations. 70% of drivers and non-drivers are selected for training, whereas the remaining 30% are kept for testing (after removing repeated mutations) consistently with a cross-validation approach. Each classifier attained a test performance that we can measure as a weighted F-score that gives more weight to precision than to recall (F-score50). The reported cross-validation performance of each model is given as an average F-score50 across base models.
Does every cancer gene have a model?
The long-term goal of boostDM is to implement models for all cancer genes and tumor types where the gene acts as a driver according to IntOGen. However, the creation of reliable models ultimately relies on two hard constraints: i) whether the estimated dN/dS of the gene is high enough to render a training set; ii) whether the observed mutations are representative enough to train a reliable model.
What is considered a reliable model?
We deem good quality models those meeting the following three criteria:
- Average training splits of size 30 or higher across the 50 base models (considering both driver and non-driver examples).
- Average cross-validation F-score50 across the 50 base models higher than 0.8.
- Discovery index high enough given the number of observed mutations in the gene and tumor type context.
As more datasets of sequenced tumors become available, we foresee that the number of reliable models will increase
What to do with mutations lacking a specific model?
To classify mutations matching gene-tumor type combinations for which the model does not fulfill the quality requirements described above, we propose to resort to more general models, i.e. models trained with mutational catalogs obtained by aggregating cohorts according to the oncotree ontology hierarchy.
How often are you planning to update the models?
We plan to update the models with every major release of IntOGen. IntOGen is updated regularly with publicly available data from somatic point mutations from patient cohorts. We foresee that as more samples are included in IntOGen, more models meeting the minimum quality required will be available.
What gene-tumor type models are featured in the website?
The current version of the web supports 736 gene-tumor type models: 359 models with highest possible tumor-type specificity according to our oncotree ontology and 377 additional models in more general tumor type contexts.
Does boostDM support feature explanations?
The tree-ensemble structure of the gradient boosting classifiers that make the base models allows the use of Shapley Additive Explanations (SHAP) to infer additive explanation models, i.e. a rule to additively split the forecast produced for each individual mutation in terms of the relative contribution by each feature. More specifically, the SHAP values associated to the features additively break down the logit prediction cast for each input mutation. In particular, SHAP values are to be interpreted as log-odds ratios. Since our models are ensembles of predictors, we report the average SHAP values for the prediction of each individual mutation across the 50 base models. Features with higher absolute SHAP values have greater contribution to the classification of a driver mutation. The sign of the SHAP value represents whether the feature value, given the other feature values, implies a higher (positive SHAP) or lower (negative SHAP) probability for the mutation to be a driver.
Did you compare boostDM against other bioinformatic scores?
We have compared boostDM against an array of bioinformatic methods retrieved from dbNSFP, including AlphaMissense, CADD, ESMb1, EVE, REVEL and VEST4. For the original release of the method, check the results of our analyses in the manuscript. To check the results corresponding to the most recent release, check the release notes.
Did you compare boostDM against experimental datasets?
We have compared boostDM against annotated collections of mutations obtained from experimental saturation mutagenesis assays, functional assays and manually curated collections of pathogenic and benign mutations. For the original release of the method, check the results of our analyses in the manuscript. To check the results corresponding to the most recent release, check the release notes.
How do I cite boostDM?
In silico saturation mutagenesis of cancer genes
Ferran Muiños, Francisco Martinez-Jimenez, Oriol Pich, Abel Gonzalez-Perez, Nuria Lopez-Bigas
DOI:10.1038/s41586-021-03771-1
What is the boostDM License?
All data released by this website is available under the Creative Commons Attribution-NonCommercial 4.0 International license. Fair attribution supports future efforts and ensures correct legacy of the data.
What did it take to develop boostDM?
boostDM has come about from a collaboration of scientists and engineers in different areas of expertise. The main contributions can be enumerated as: 1) conceptualizing, implementing and testing the learning strategy; 2) conducting validation and benchmark analyses; 3) processing the data provided by IntOGen; 4) implementing the bioinformatic pipeline; 5) implementing the website; 6) preparing the accompanying figures and documentation; 7) maintaining the HPC infrastructure to carry out all the tests and analyses; 8) following-up, putting ideas together and discussing the most suitable analyses and steps forward; 9) coordinating the team efforts.
Who contributed to boostDM?
boostDM is a team effort from the Biomedical Genomics lab (https://bbglab.irbbarcelona.org/) at the Institute for Research in Biomedicine (IRB Barcelona). Ferran Muiños, Francisco Martinez-Jimenez, Oriol Pich, Abel Gonzalez-Perez and Nuria Lopez-Bigas led the main conceptualization, development and validation of the first release.
Legacy: Iker Reyes-Salazar, Loris Mularoni, David Martínez Millán, Electra Tapanari and Claudia Arnedo-Pac provided additional technical support to make the first release a reality.
Current Release The current release has been developed by Federica Brando, Santi Demajo, Paula Gomis, Miguel L. Grau, Ferran Muiños, Stefano Pellegrini, Joan E. Ramis-Zaldívar and Mònica Sánchez-Guixé, under the supervision of Abel González-Pérez and Núria López-Bigas.
Usability Questions
What is the current status of the website?
The website is currently a stable alpha version subject to a few minor adjustments. Any feedback or bug reporting is invaluable for us. Please, would you come across any issue, let us know here: bbglab@irbbarcelona.org.
How to read the results?
There are essentially five different types of columns:- Gene information: gene symbol (gene), gene identifier (ENSEMBL_GENE), transcript identifier (ENSEMBL_TRANSCRIPT).
- Mutation descriptors: chromosome (chr), position (pos), alternate allele (alt), amino acid change (aachange).
- Mutational features used to match each mutation to a tumorigenic potential: CLUSTL; HotMaps; smRegions (signif_motif); conservation score (PhyloP); NMD (nmd); PTM site annotation (Acetylation, Methylation, Phosphorylation, Regulatory_Site, Ubiquitination); coding consequence type (csqn_type_*).
- Predicted tumorigenic potential (boostDM_score, boostDM_class).
- Feature explanation values (SHAP) inferred for each individual prediction (shap_*, followed by the name of the mutational feature).
What is the reference genome?
GRCh38/hg38
What transcripts and variant consequence types are we using?
We use Ensembl VEP v111 and MANE Select transcripts to align with common standards used in the clinics. The consequence type of a given mutation is defined as the most damaging consequence types among all consequence types consistent with the MANE Select transcript and VEP version.
What do the tumor type acronyms mean?
You can download the docs describing the tumor type ontology from the downloads page.
What gene-tumor type combinations are included?
First and foremost, only genes classified as drivers by IntOGen in specific tumor types can be part of valid gene-tumor type combinations. Second, since boostDM learns to evaluate the driver potential of mutations in driver genes from the training examples we feed it on, for some gene-tumor type combinations the performance after training may be poor, generally because of the low number of training examples and/or low representability of the mutations observed for that gene and tumor type. We are presenting the results for 736 gene-tumor type combinations which attain a minimum quality (see What gene-tumor type models are featured in the website? ).
Can I run the code?
The boostDM training and prediction pipeline can be forked from this repo: @bbglab/boostdm-pipeline. Please, follow the documentation provided in the repo to fulfill all the data and software requirements.
Can I check the full documentation?
Yes, you can download the full documentation of the current version of the pipeline from here.
Can I access previous releases of boostDM?
Yes, if you want to download in-silico-saturation tables from previous releases from BoostDM please visit the Downloads tab. Alternatively, if you are interested in browsing the previous release of the BoostDM website, please go to boostDM legacy.
Can I provide feedback?
Any feedback is invaluable to us. Please, feel free to drop your comments here: bbglab@irbbarcelona.org.
Why does this site use cookies and what for?
We are using Google Analytics cookies to track usage of our site. boostDM is a publicly-funded project and these metrics are important to keep support for this project.