- General Questions
- Usability Questions
General Questions
What is boostDM-CH?
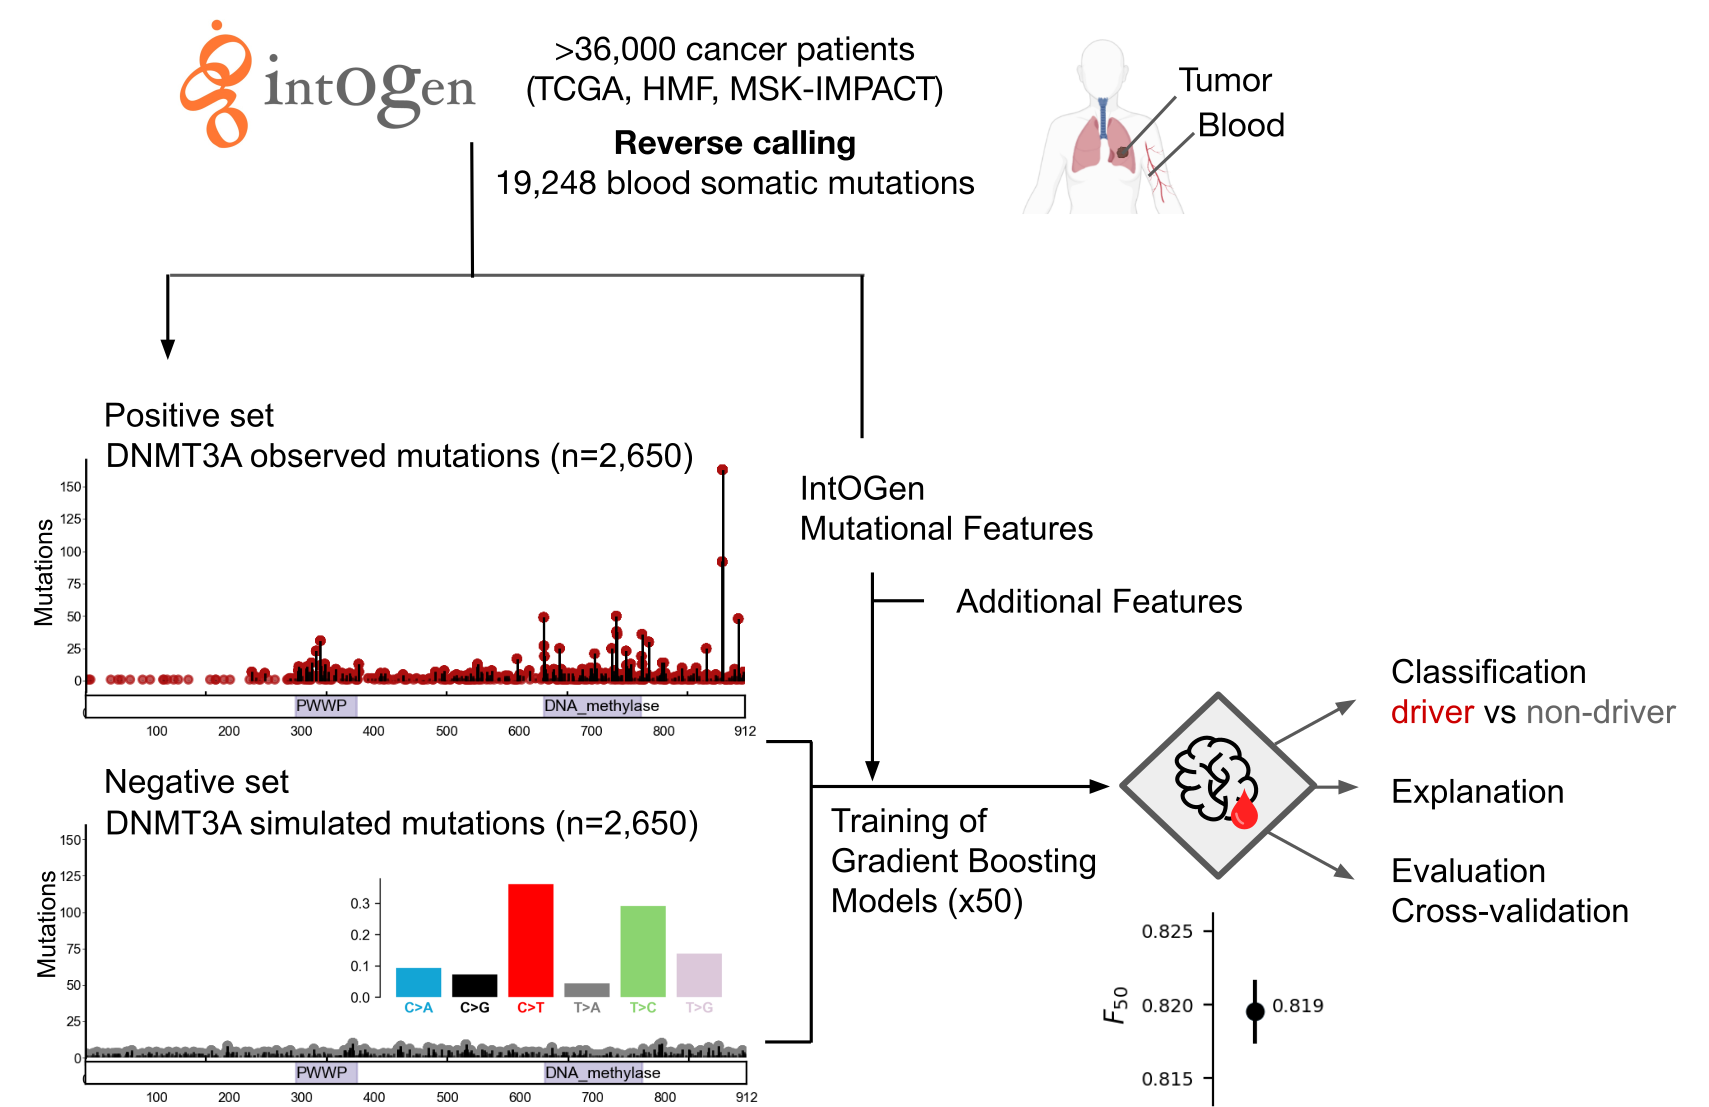
boostDM-CH is a computational method to conduct in silico saturation mutagenesis of Clonal Hematopoiesis (CH) genes, adapted from boostDM cancer. Using mutational features, the method scores and classifies all possible single base substitutions in CH genes by their potential to be involved in in clonal selection.
How does it work?
The method is based on the analysis of blood somatic mutations from cancer patient cohorts obtained by reverse calling, that is to say,
through the comparison of the genomic sequence of the blood and the tumor sample from the same donor, and their
site-by-site annotation with relevant features. We have called this process reverse mutation calling, as it reverses
the normal use of these two samples in cancer genomics by using the tumor sample as the germline control.
The compendium of clonal hematopoiesis (CH) genes, the blood somatic mutations, and the mutational features
for each CH gene have been derived from the systematic analysis of more than 36,000 cancer patients
from 3 large studies (TCGA, HMF, MSK-IMPACT) (www.intogen.org/ch).
Other relevant features have been collected from public databases.
How does boostDM-CH training work?
boostDM-CH resorts to supervised learning using a training dataset made of "driver" and "non-driver" mutations from a CH gene. By means of dN/dS analysis (dNdScv), we can establish a proportion of mutations observed that cannot be explained by neutral evolution (excess). To train boostDM-CH, we include in the "driver" or positive training set all the mutations observed in CH driver genes (IntOGen-CH) with high enough excess (≥ 85%). Since the excess can be estimated in a consequence-type specific manner, we can include only those mutations with consequence types having high excess. On the other hand, the "non-driver" or negative training set are mutations randomly drawn with flat probabilities based on the tri-nucleotide context rates observed across all blood somatic mutations identified in the cohort.
Where do you get the data from?
BoostDM-CH models feed on IntOGen-CH.
What features do the models use?
Each mutation provided for training is annotated with a set of mutational
features, which the classification task exploits to discriminate between
observed "drivers" and "passengers" in clonal hematopoiesis.
Some mutational features have been derived from the systematic analysis
of tens of thousands of blood-tumor paired samples from IntOGen-CH
(e.g., linear clusters, 3D clusters, enriched functional domains).
Other relevant features, such as nucleotide conservation or post-translational
modifications are collected from public databases of biological sequences.
Here we introduce a brief description of the features the user will find in this site. For a more detailed account, please refer to the manuscript.-->
- SYNONYMOUS, MISSENSE, NONSENSE: whether the mutation has any of these consequence types at the protein level (ENSEMBL Variant Effect Predictor).
- SPLICE: whether the mutation has the potential to disrupt RNA splicing in the canonical transcript (ENSEMBL Variant Effect Predictor).
- ACETYLATION, METHYLATION, PHOS (phosphorylation), REG (regulatory site), UB (ubiquitination): whether the mutation maps to a protein site known to undergo post-translational modification (PhosphoSitePlus).
- 3CT: whether the mutation maps to a mutational cluster in the 3D protein conformation (HotMaps3D).
- LCS: linear cluster score (oncodriveCLUSTL).
- DOM: whether the mutation maps to a PFAM domain that is recurrently mutated (smRegions).
- PHYLOP: nucleotide conservation score asserted through multiple sequence alignments of 99 vertebrate genomes against the human genome (100-way score).
- NMD: whether the (nonsense) mutation is reported in the last exon of the canonical transcript, implying higher chances to undergo inefficient nonsense-mediated mRNA decay.
How do you evaluate the quality of the models?
Each model generated by boostDM-CH results from the aggregation of a collection of classifiers trained with partial views of the training data. In the current version, 50 classifiers were trained with random partial views of the set of “driver” and “passenger” mutations. For each classifier as many passengers as drivers are independently drawn. Then 70% of drivers and passengers are selected for training, whereas the remaining 30% are kept for testing (after removing repeated mutations) consistently with a cross-validation approach. We can then measure the performance of each base classifier via the area under the Receiver Operating Characteristic curve (auROC). The quality of each model is obtained through the calculation of the F50-score resulting from the aggregation of the classification of mutations across the 50 test sets. For details, refer to the manuscript.
Does every gene have a model?
The long-term goal of boostDM-CH is to train a specific model for every CH gene.
However, the creation of a reliable model ultimately relies on two hard constraints:
i) whether the estimated dN/dS of the gene is high enough to render a training set;
ii) whether the number of observed mutations is enough to create a
reliable predictor.
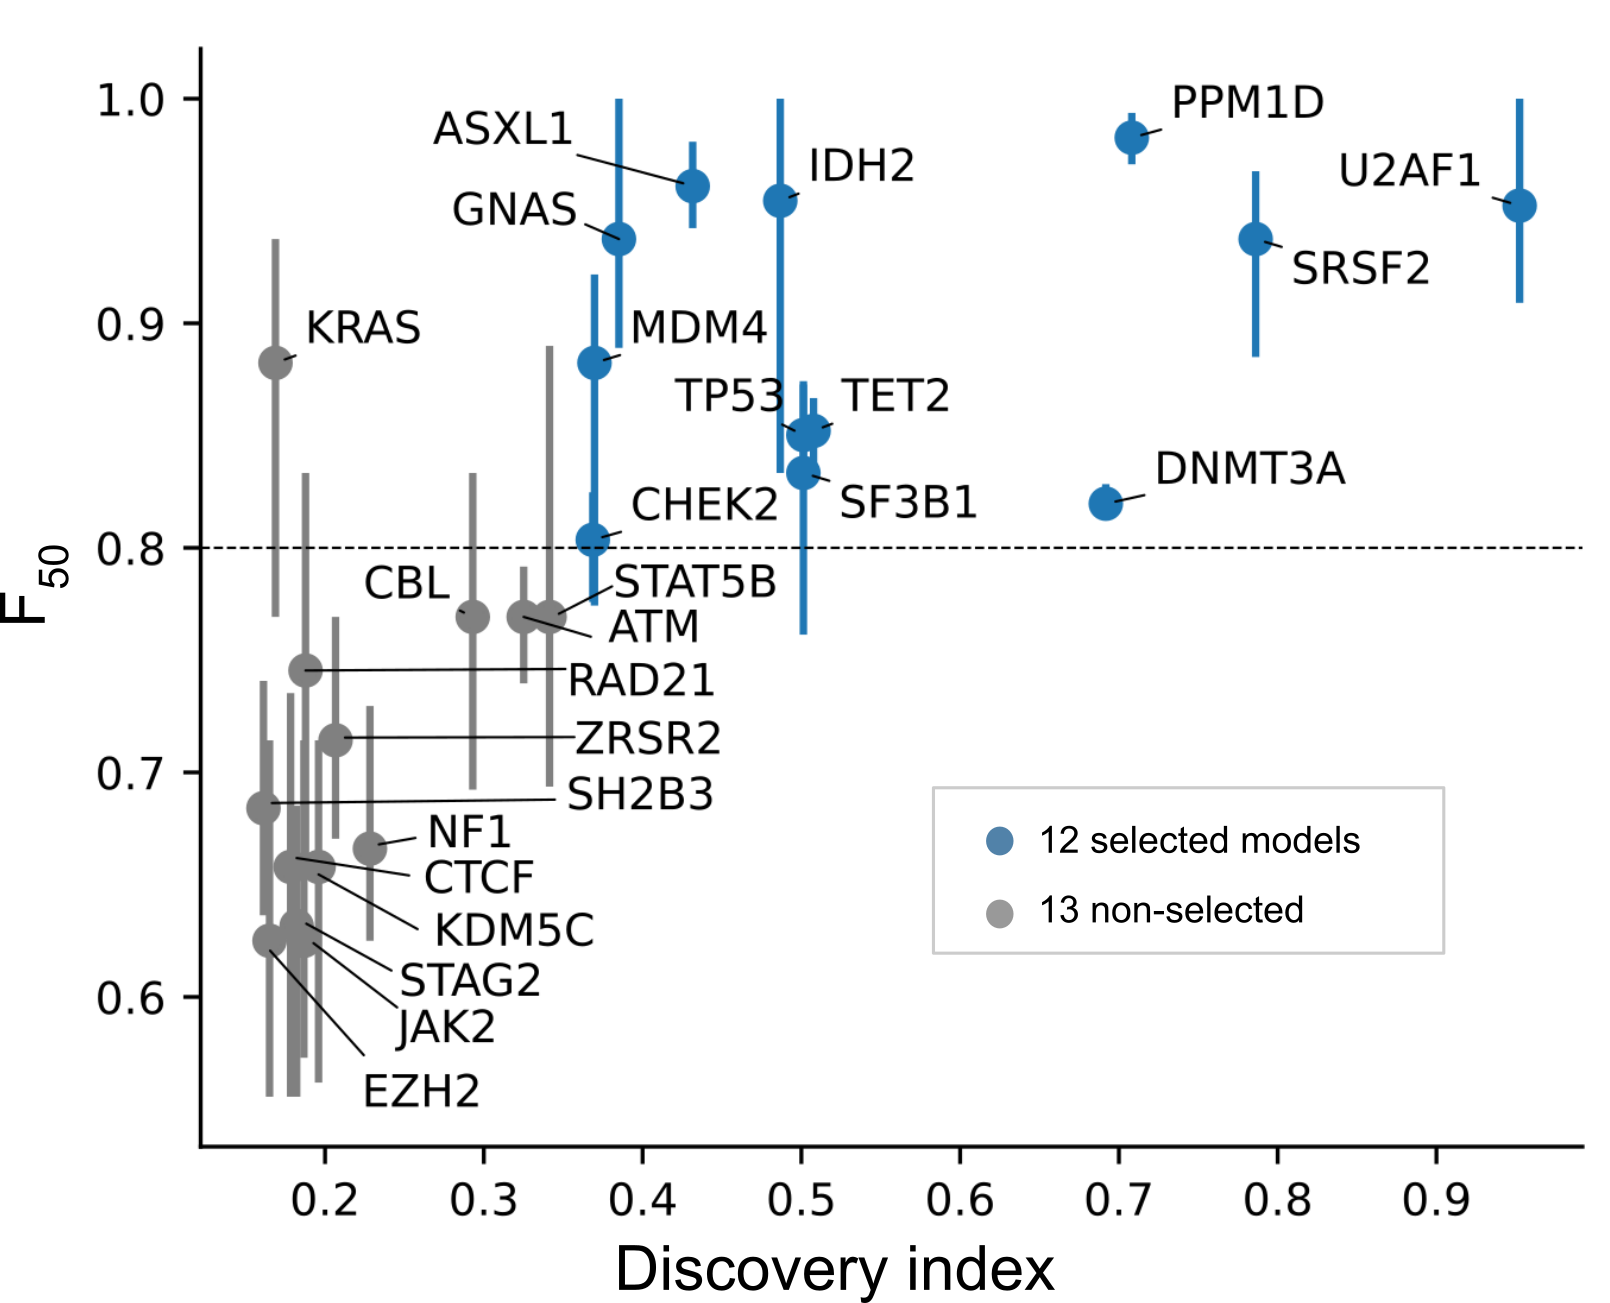
What is considered a reliable model?
The cross-validation performance of specific models typically increases with the number of mutations employed to train them. We deem good quality models those trained with ≥ 30 mutations, with average cross-validation F-score50 ≥ 0.8 and such that the observed mutations are highly representative (high discovery index, see figure below). As more datasets of sequenced blood-tumor pairs become available, we foresee that the number of reliable models will increase.
How often are you planning to update the models?
We plan to update the models with every major release of IntOGen-CH. IntOGen-CH will be updated regularly with publicly available data from somatic point mutations from patient cohorts. We foresee that as more samples are included in IntOGen-CH, more specific models meeting the minimum quality required will be available in BoostDM-CH.
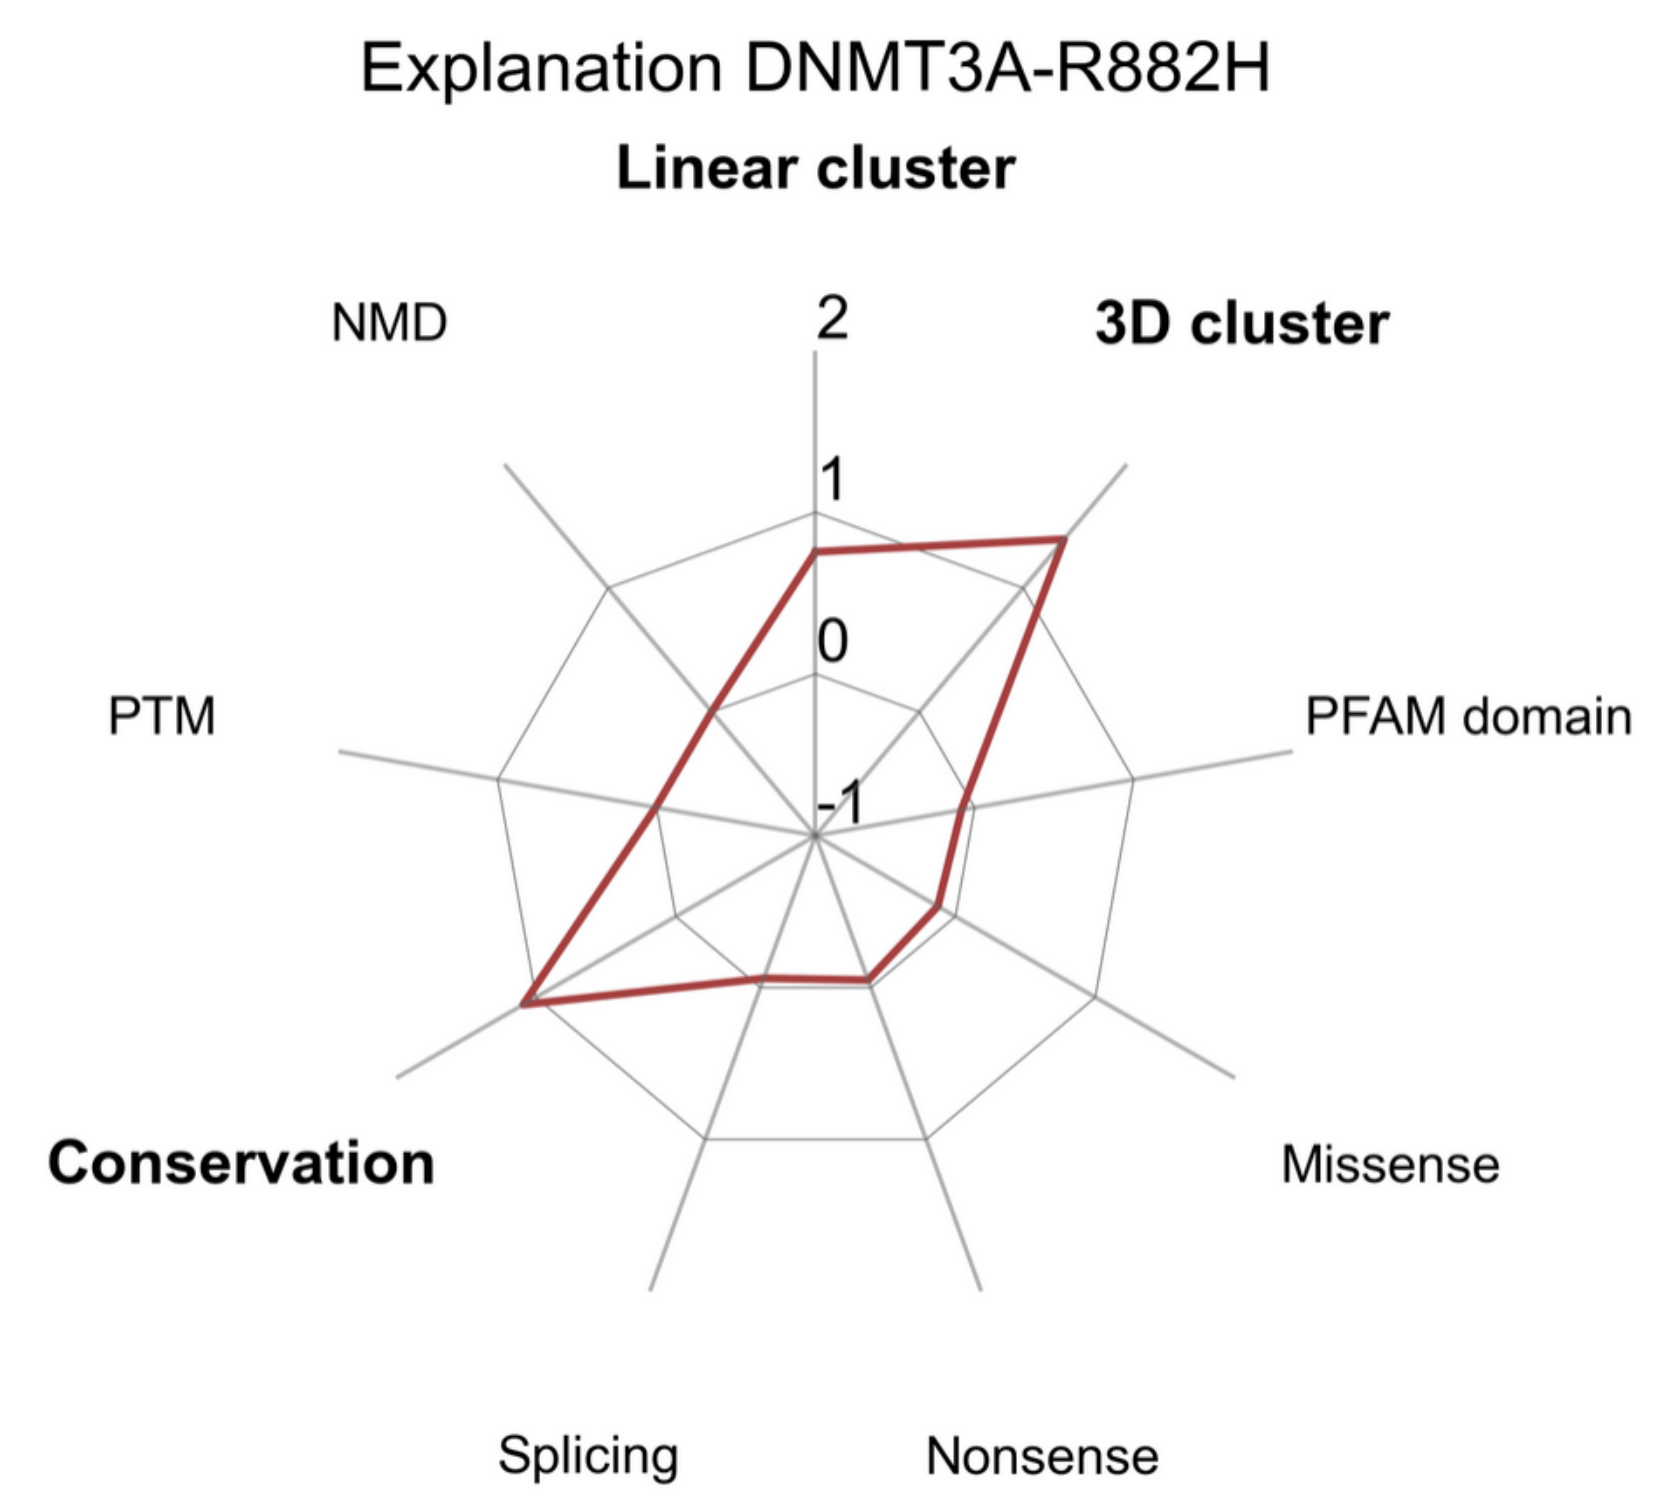
Does boostDM-CH support feature explanations?
The tree-ensemble structure of the gradient boosting classifiers allows the use of Shapley Additive Explanations (SHAP) to infer additive explanation models, i.e. a rule to additively split the forecast produced for each individual mutation in terms of the relative contribution of each feature. More specifically, the SHAP values associated to the features additively break down the logit prediction cast for each input mutation. In particular, SHAP values are to be interpreted in the log-odds scale. Since our models are ensembles of predictors, we report the average SHAP values for the prediction of each individual mutation. Features with higher absolute SHAP values have a greater contribution to the classification of a driver mutation. The sign of the SHAP value represents whether the feature value, given the other feature values, implies a higher (positive SHAP) or lower (negative SHAP) probability for the mutation to be a driver.
Have you validated boostDM-CH against experimental datasets?
We conducted an independent evaluation of boostDM-CH against an annotated collection of DNMT3A mutations obtained from experimental saturation mutagenesis assays. We reported the results of this analysis in our manuscript.
How do I cite boostDM-CH?
Identification of Clonal Hematopoiesis Driver Mutations through In Silico Saturation Mutagenesis
Santiago Demajo, Joan Enric Ramis-Zaldivar, Ferran Muiños, Miguel L Grau, Maria Andrianova, Núria López-Bigas, Abel González-Pérez
DOI:10.1158/2159-8290.CD-23-1416
Please, also cite boostDM cancer publications:
In silico saturation mutagenesis of cancer genes
Ferran Muiños, Francisco Martinez-Jimenez, Oriol Pich, Abel Gonzalez-Perez, Nuria Lopez-Bigas
DOI:10.1038/s41586-021-03771-1
What is the boostDM-CH License?
All data released by this website is available under the Creative Commons Attribution-NonCommercial 4.0 International license. Fair attribution supports future efforts and ensures correct legacy of the data.
What did it take to develop boostDM-CH?
BoostDM-CH has come about as a result of a multidisciplinary effort contributed by a team of scientists and engineers in differents areas of expertise: 1) conceptualizing, implementing and testing the learning strategy; 2) conducting validation analyses; 3) processing the data provided by IntOGen-CH; 4) implementing the workflow; 5) implementing the website; 6) preparing the accompanying figures and documentation; 7) maintaining the HPC infrastructure to carry out all the tests and analyses; 8) following-up, putting ideas together and discussing the most suitable analyses and steps forward; 9) coordinating the team efforts.
Who contributed to boostDM-CH?
boostDM-CH is a team effort from the Biomedical Genomics lab (https://bbglab.irbbarcelona.org/) at the Institute for Research in Biomedicine (IRB Barcelona). Santiago Demajo and Joan Enric Ramis-Zaldivar, carried out most analyses of the results of the application of the boostDM-CH models to the mutations in the discovery cohorts, validation cohorts and UKB. Ferran Muiños carried out the training and validation of boostDM-CH models and contributed to downstream analyses. Santiago Demajo, Joan Enric Ramis-Zaldivar and Ferran Muiños generated the figures in the manuscript. Miguel L Grau carried out the identification of somatic mutations in 12 CH driver genes across UKB donors. Maria Andrianova carried out the analysis of fitness of recurrent CH mutations across UKB donors. Santiago Demajo, Ferran Muiños, Abel Gonzalez-Perez and Nuria Lopez-Bigas conceived the project. Abel Gonzalez-Perez and Nuria Lopez-Bigas supervised the project and its analyses and prepared the first draft of the manuscript. All authors contributed to the discussion of results and the completion of the manuscript. We also acknowledge Martina Gasull and Paula Gomis for support in data access and Federica Brando for key support in the development of the boostDM-CH website.
Usability Questions
What is the current status of the website?
The website is currently a stable alpha version subject to a few minor adjustments. Any feedback or bug reporting is invaluable for us. Please, would you come across any issue, let us know here: bbglab@irbbarcelona.org.
How to read the results?
There are essentially six different columns in the results tables:
- Gene information: gene symbol (gene), gene identifier (ENSEMBL_GENE), transcript identifier (ENSEMBL_TRANSCRIPT).
- Mutation descriptors: chromosome (chr), position (pos), alternate allele (alt), amino acid change (aachange).
- Mutational features used to match each mutation to a clonal hematopoiesis potential: CLUSTL scores; HotMaps scores; smRegions score (signif_motif); conservation score (PhyloP); last exon (nmd); post-translational modification site annotations (Acetylation, Methylation, Phosphorylation, Regulatory_Site, Ubiquitination); coding consequence type (csqn_type_*).
- Predicted clonal hematopoiesis potential (boostDM_score, boostDM_class).
- Feature explanation values (SHAP) inferred for each individual prediction (shap_*, followed by the name of the mutational feature).
Which genomic transcript is chosen for each gene?
We use the canonical transcript defined by ENSEMBL as the reference transcript for each gene in our analysis. The current release uses VEP.92 from human GRCh38 genome assembly.
Can I run the code to perform the predictions?
The training and prediction pipeline can be forked from this repo: https://github.com/bbglab/boostdm-pipeline/tree/1.0.1-ch. Please, note that this pipeline completely relies on the output of the IntOGen-CH pipeline. Please, follow the documentation provided in the repo to make sure you fulfill all the data and software requirements.
Can I provide feedback?
Any feedback is invaluable to us. Please, feel free to drop your comments here: bbglab@irbbarcelona.org.
Why does this site use cookies and what for?
We are using Google Analytics cookies to track usage of our site. boostDM-CH is a publicly-funded project and these metrics are important to keep support for this project.