Select one of the uses cases below to learn how to use OncoPaD:
In this case the user has its own list of genes relevant in glioblastoma (formed by 13 genes, see screenshots below) and he wants to design a panel for them. By using OncoPaD the user can asses the performance of a panel with the selected genes and obtain ancillary information on them like relevant mutations of the genes or which fragments tend to accumulate the largest fraction of mutations.
1) The input
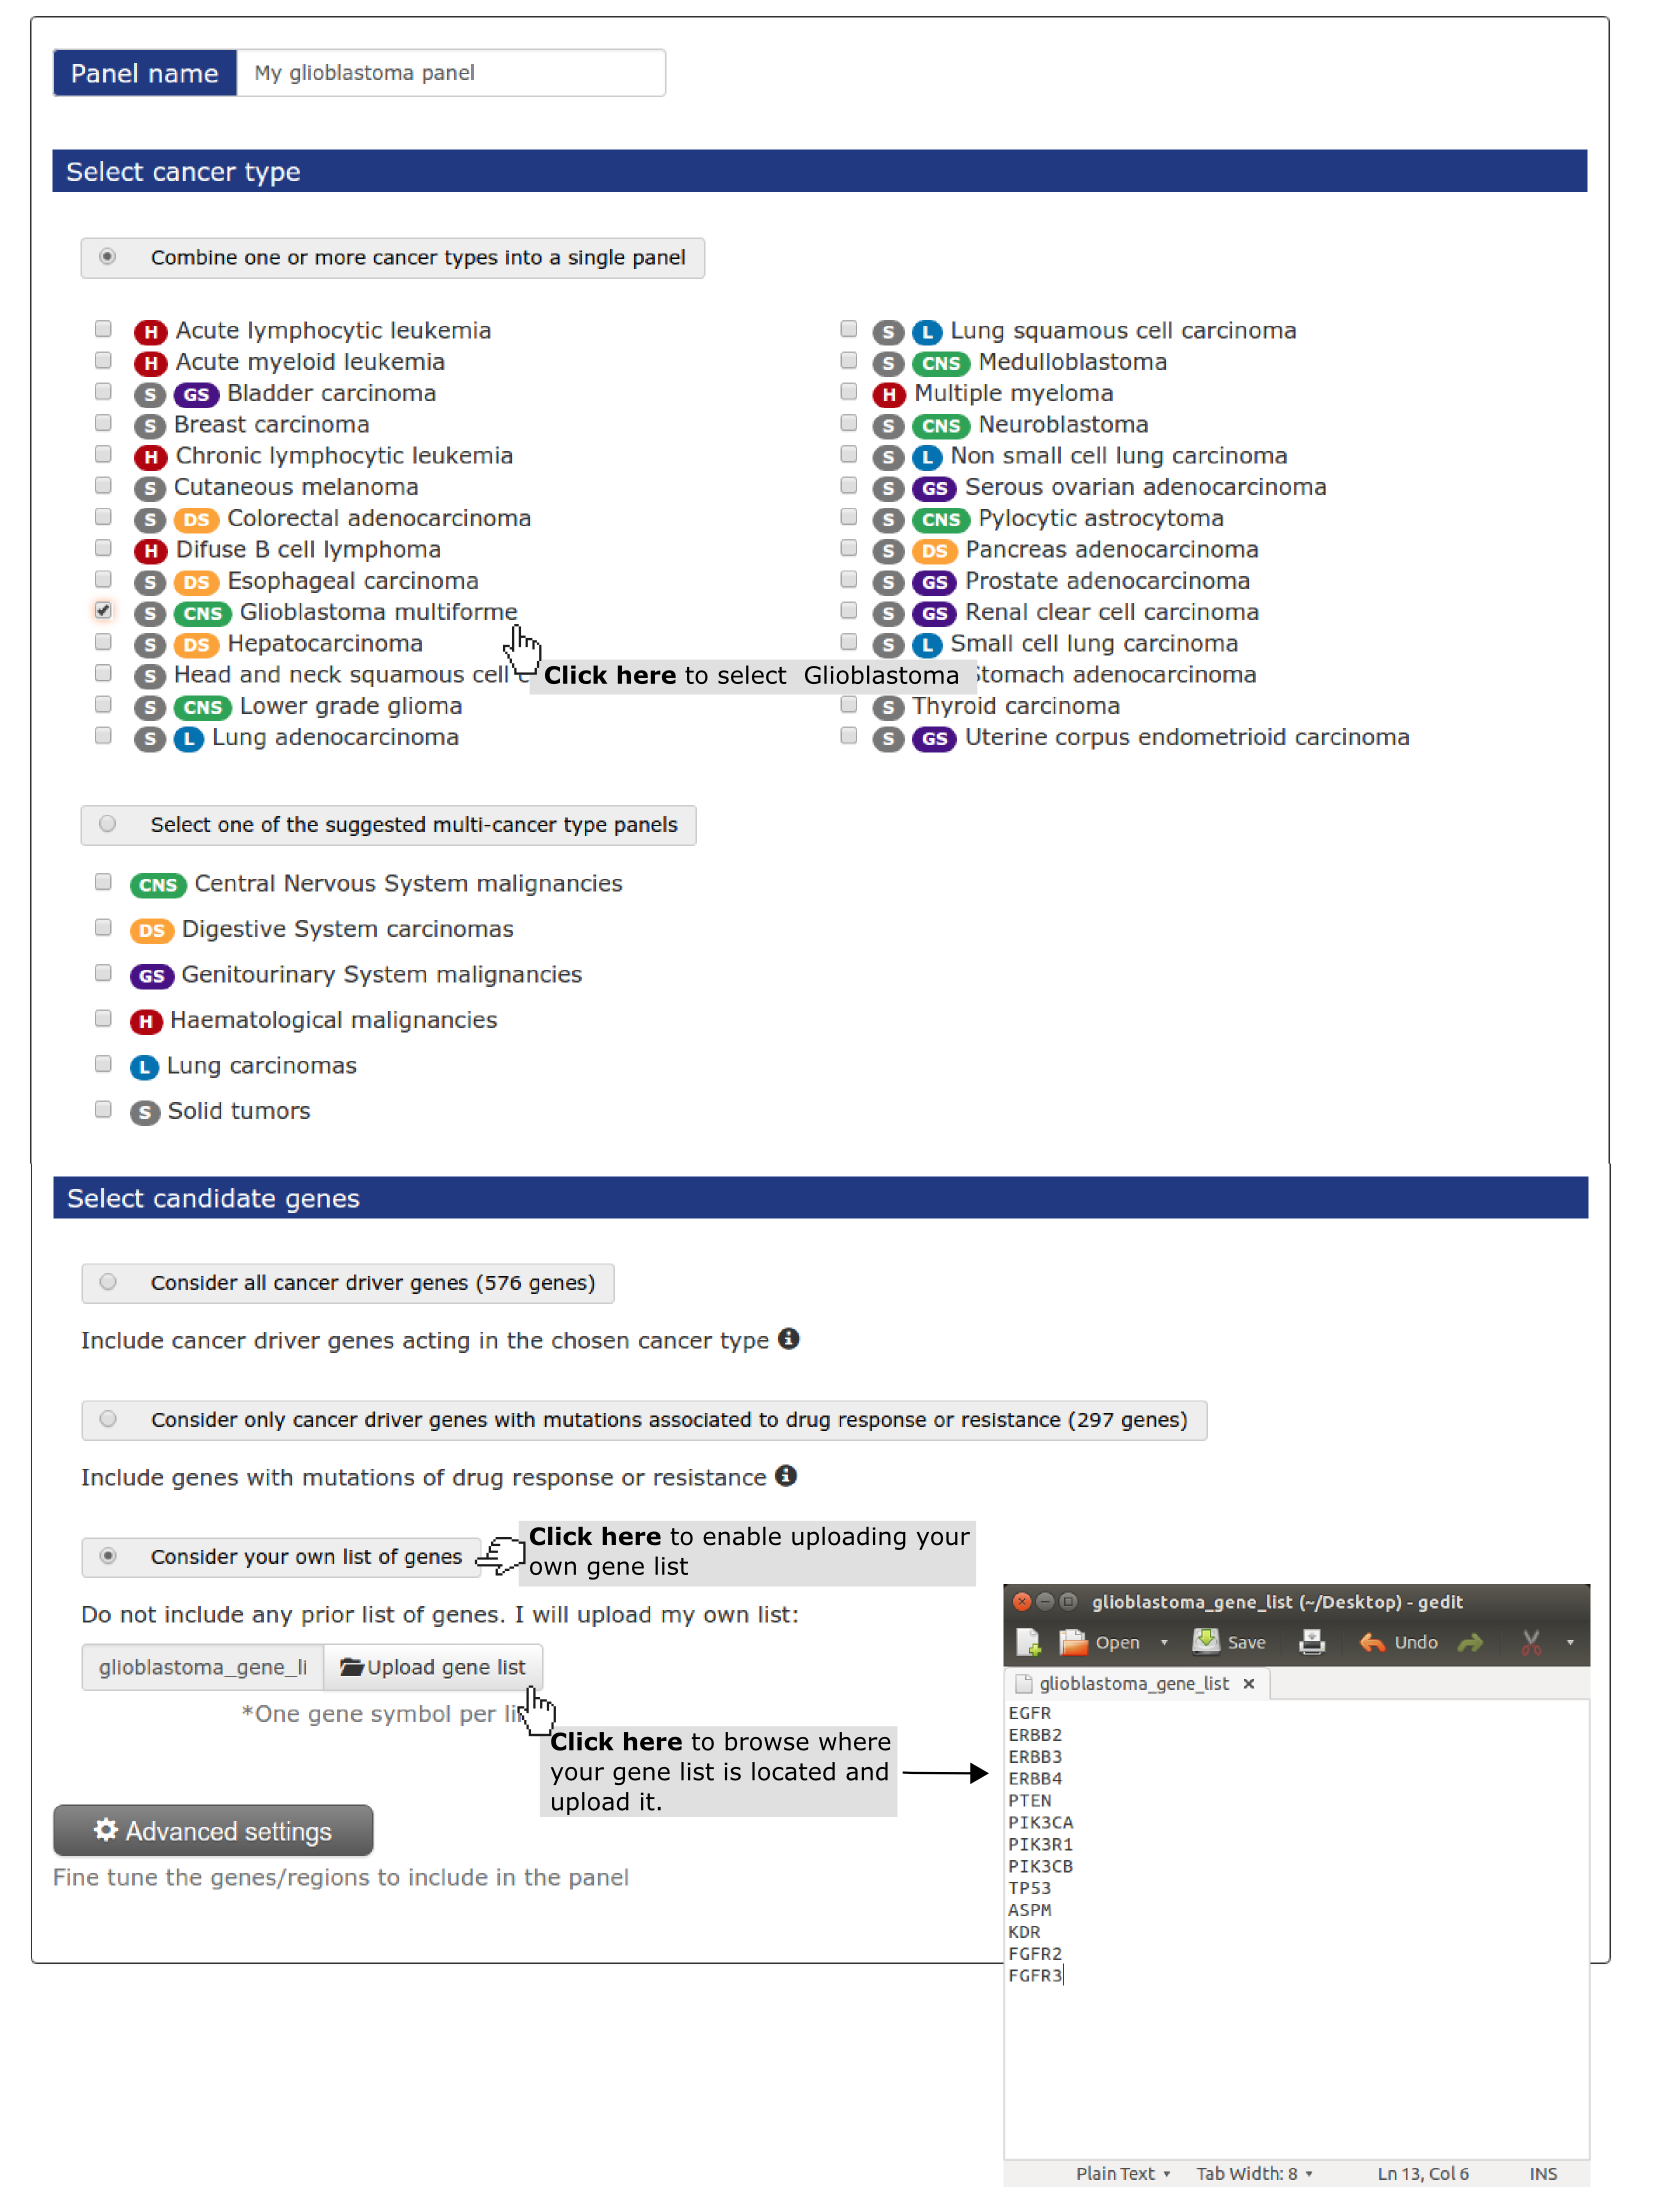
- Select a name for the panel (My panel is the default if no name is given).
- Select a cancer type (mandatory). In this case study we have selected ‘ glioblastoma multiforme.
- Next, we need to specify that we are going to use our own list of genes. Next step is uploading a file with the gene list (one gene per row) (see screenshot below). You can do it with applications such as Notepad (Windows), TextEdit (Mac OS X) or Gedit (Linux). In TextEdit you should convert it to plain activating “Format > Make Plain Text”. If you are having trouble with any of previous applications, you can download Sublime Text, a free text editor. If you have your gene list in Excel or Numbers just copy and paste it to any of the text editors mentioned.
- Finally the user wants to consider all the loss of function genes he has uploaded - PTEN, PIK3R1 and TP53 - as whole genes instead of through their regions. As shown in Use case 2 he need to go to Advanced settings to do it.
2) The results
These are organised in a series of short reports characterizing the panel designed.
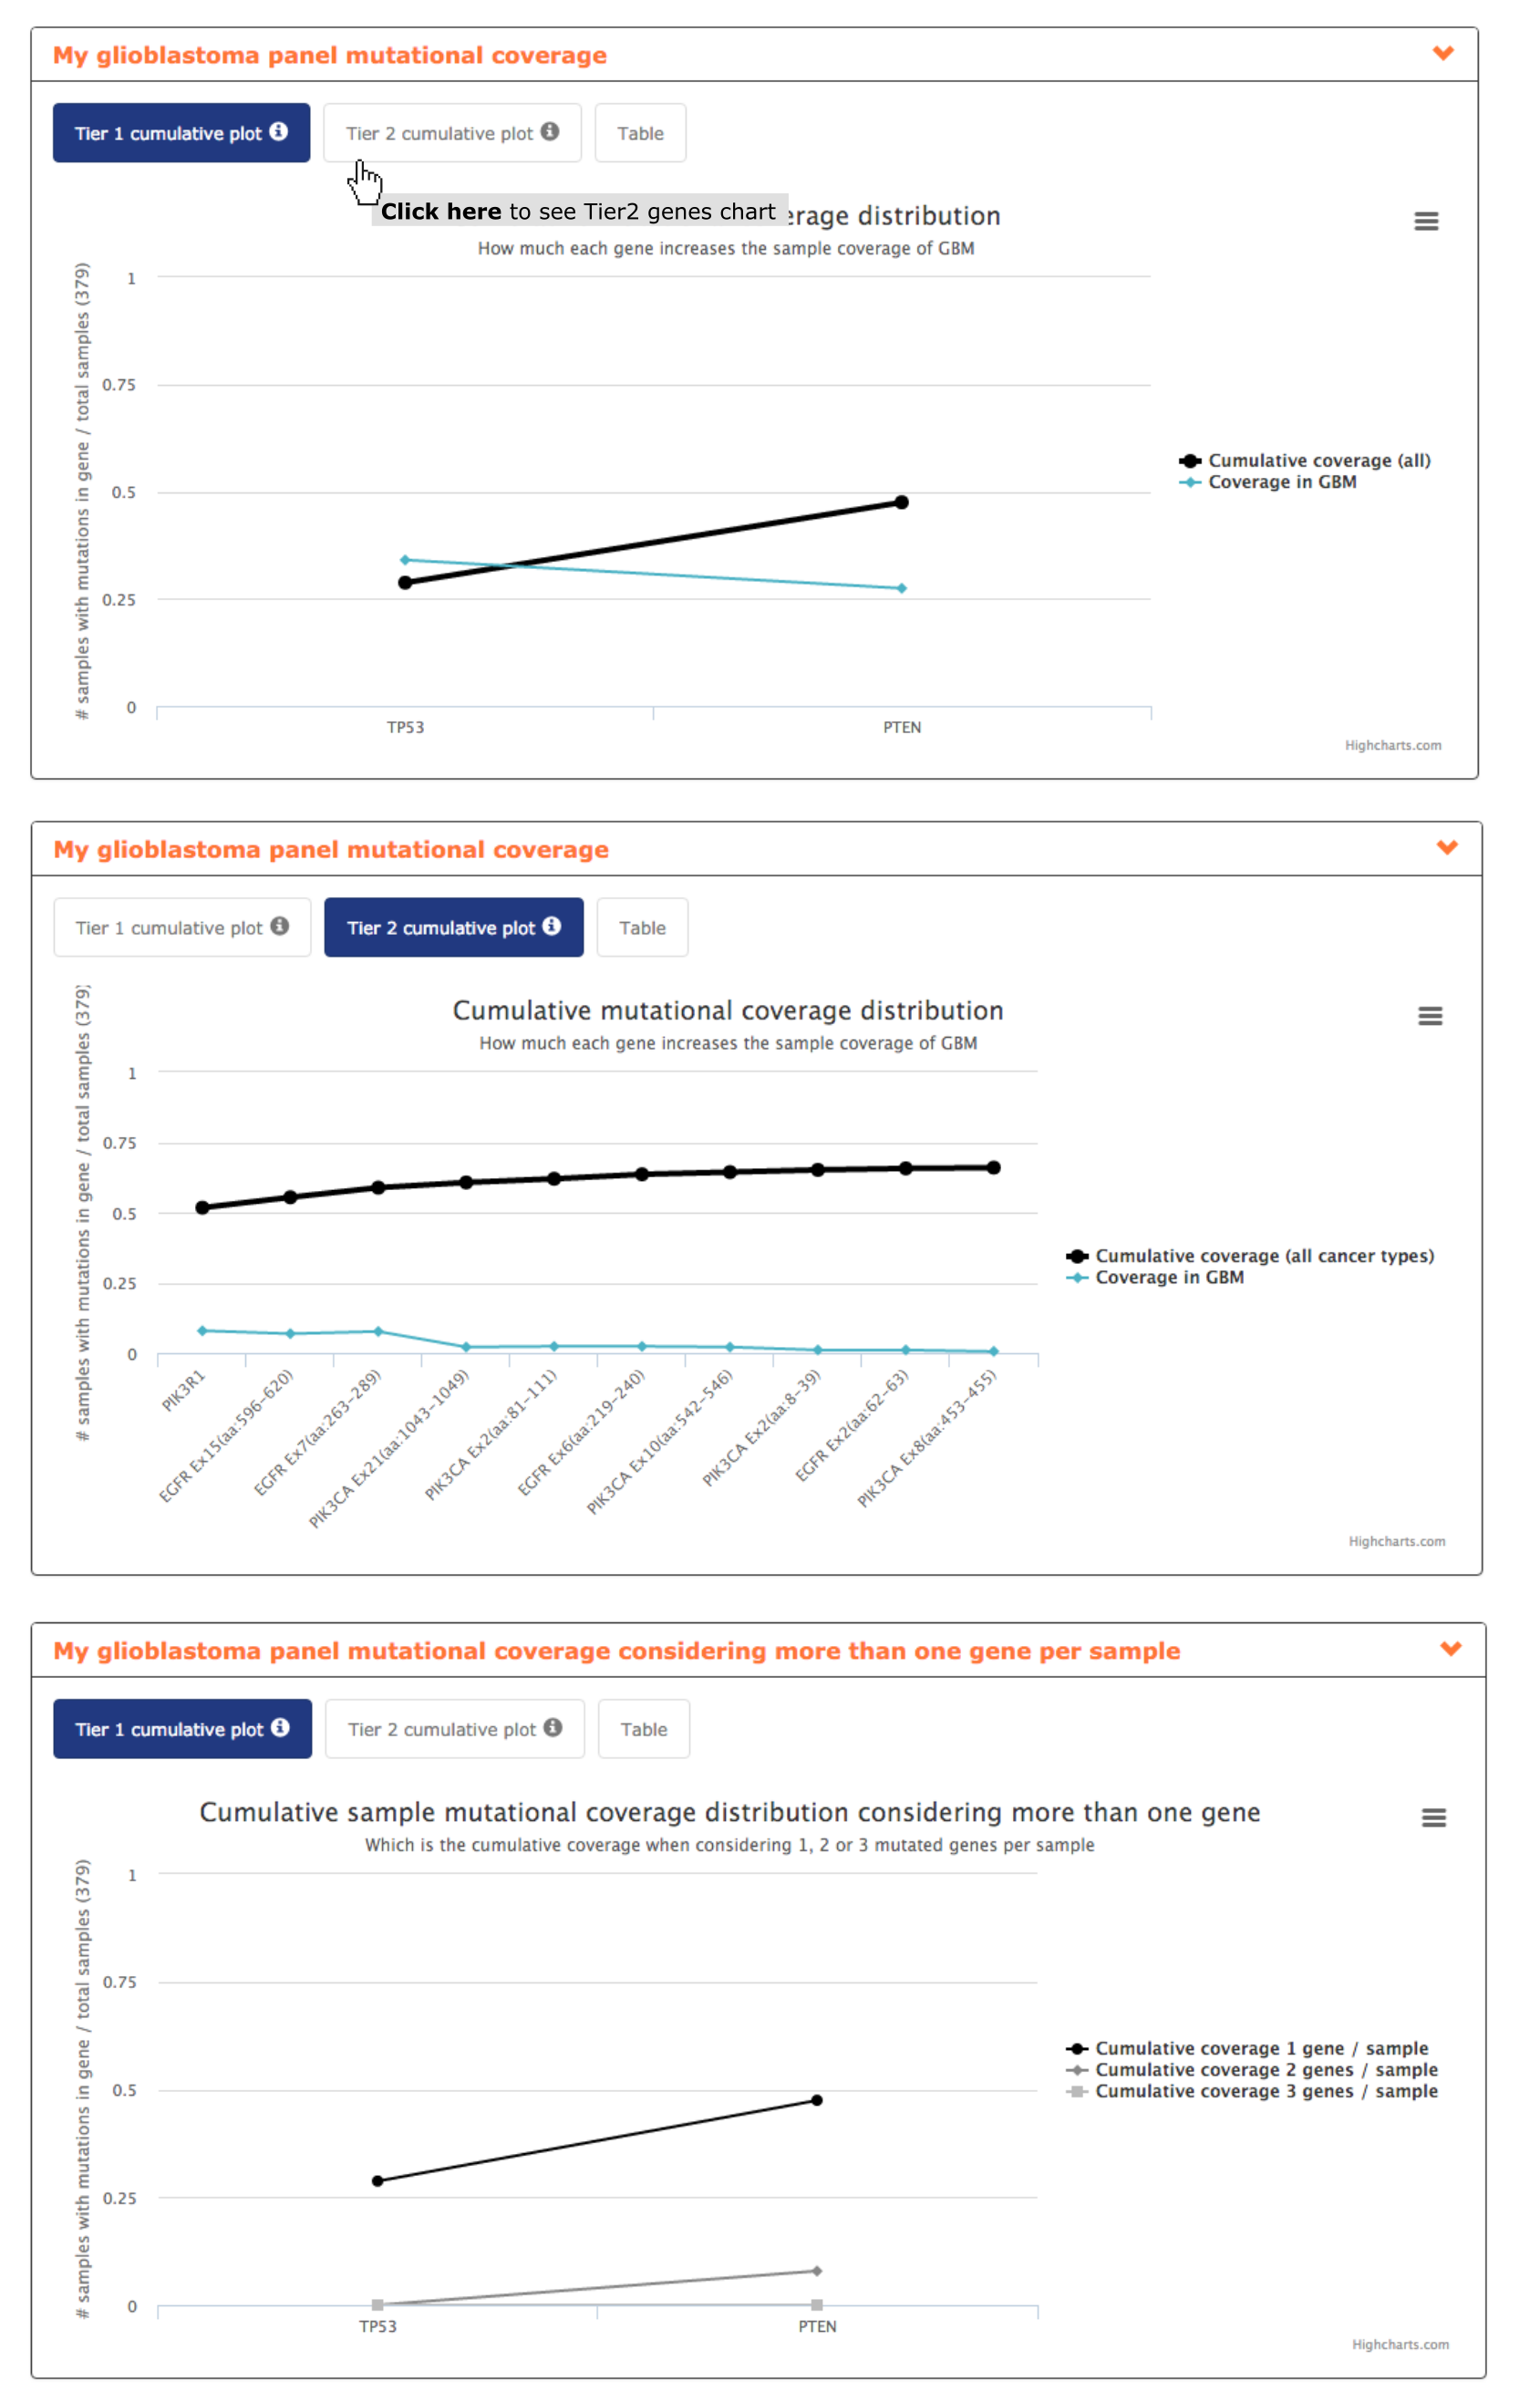
- The panel mutational coverage report plot shows to the users how considering only 2 of his genes, TP53 and PTEN, the panel can achieve a coverage of almost 50% of glioblastoma samples. Taking into account Tier 2 genes the coverage can be increased until 66% by including PIK3R1 and several regions of EGFR and PIK3CA. Hence, this report allows highlighting to the user the inclusion of 5/13 panel gene candidates as the others do not show an increase on panel coverage (see screenshots below).
- From mutational coverage considering more than one gene per sample the user can interpret how in the 28.7% of the samples mutated in TP53 only 7.9% of them are mutated in PTEN too. Suggesting a mutual exclusion pattern of these two genes in glioblastoma and hence being of interest including both in the panel (see screenshot below).
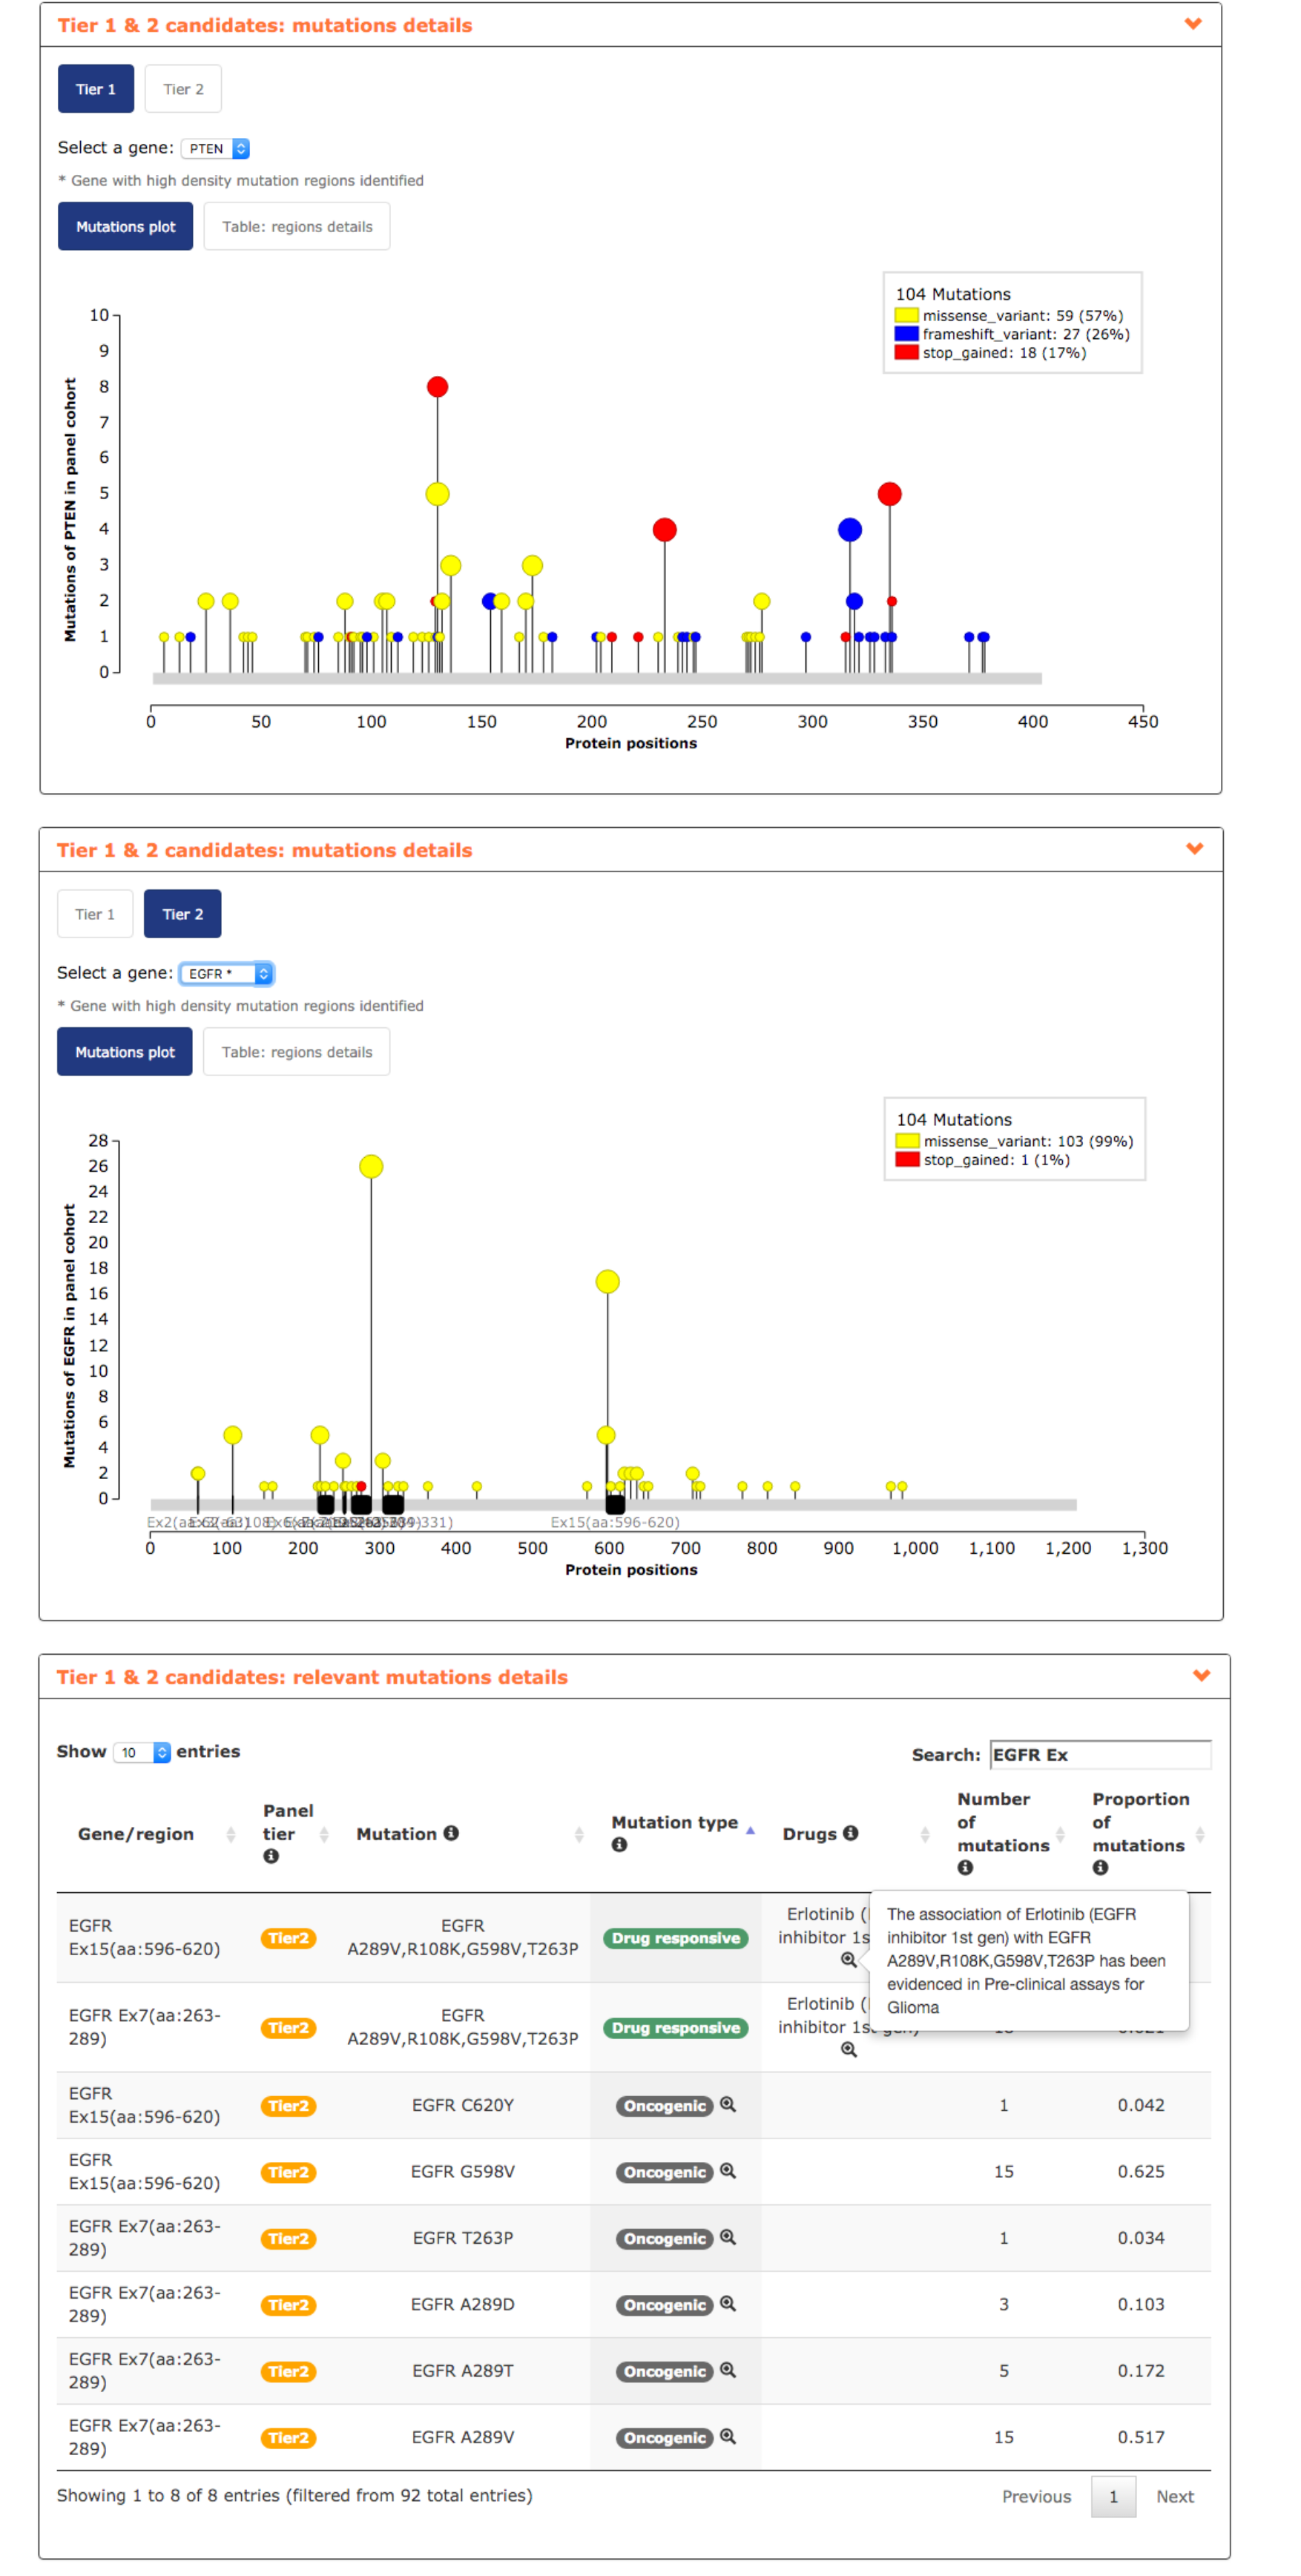
- In mutations details report, the user can visualize the distribution of the mutations in his genes of interest. It can be observed how mutations in APC are spread across its sequence while EGFR mutations tend to accumulate in 5 regions and by including only them in a glioblastoma panel the user decreases the amount of DNA to be sequenced keeping the same coverage (see screenshots below).
- Finally, relevant mutations report reveals interesting information such as the actionability of EGFR exon 15 and 7, associated to the response of the EGFR inhibitor Gefitinib used in lung cancer and being tested in pre-clinical assays in glioblastoma. Additionally, EGFR exons 15 and 7 bear several mutations validated as oncogenic (see screenshot below).
Here, we describe the use of OncoPaD to design a panel aimed at characterize colorectal adenocarcinoma cell lines according their driver alterations or to be used for early detection/stratification of colorectal patient samples. To this end, we want to design a panel based on the list of driver genes.
1) The input
- Select a name for the panel (My panel is the default if no name is given).
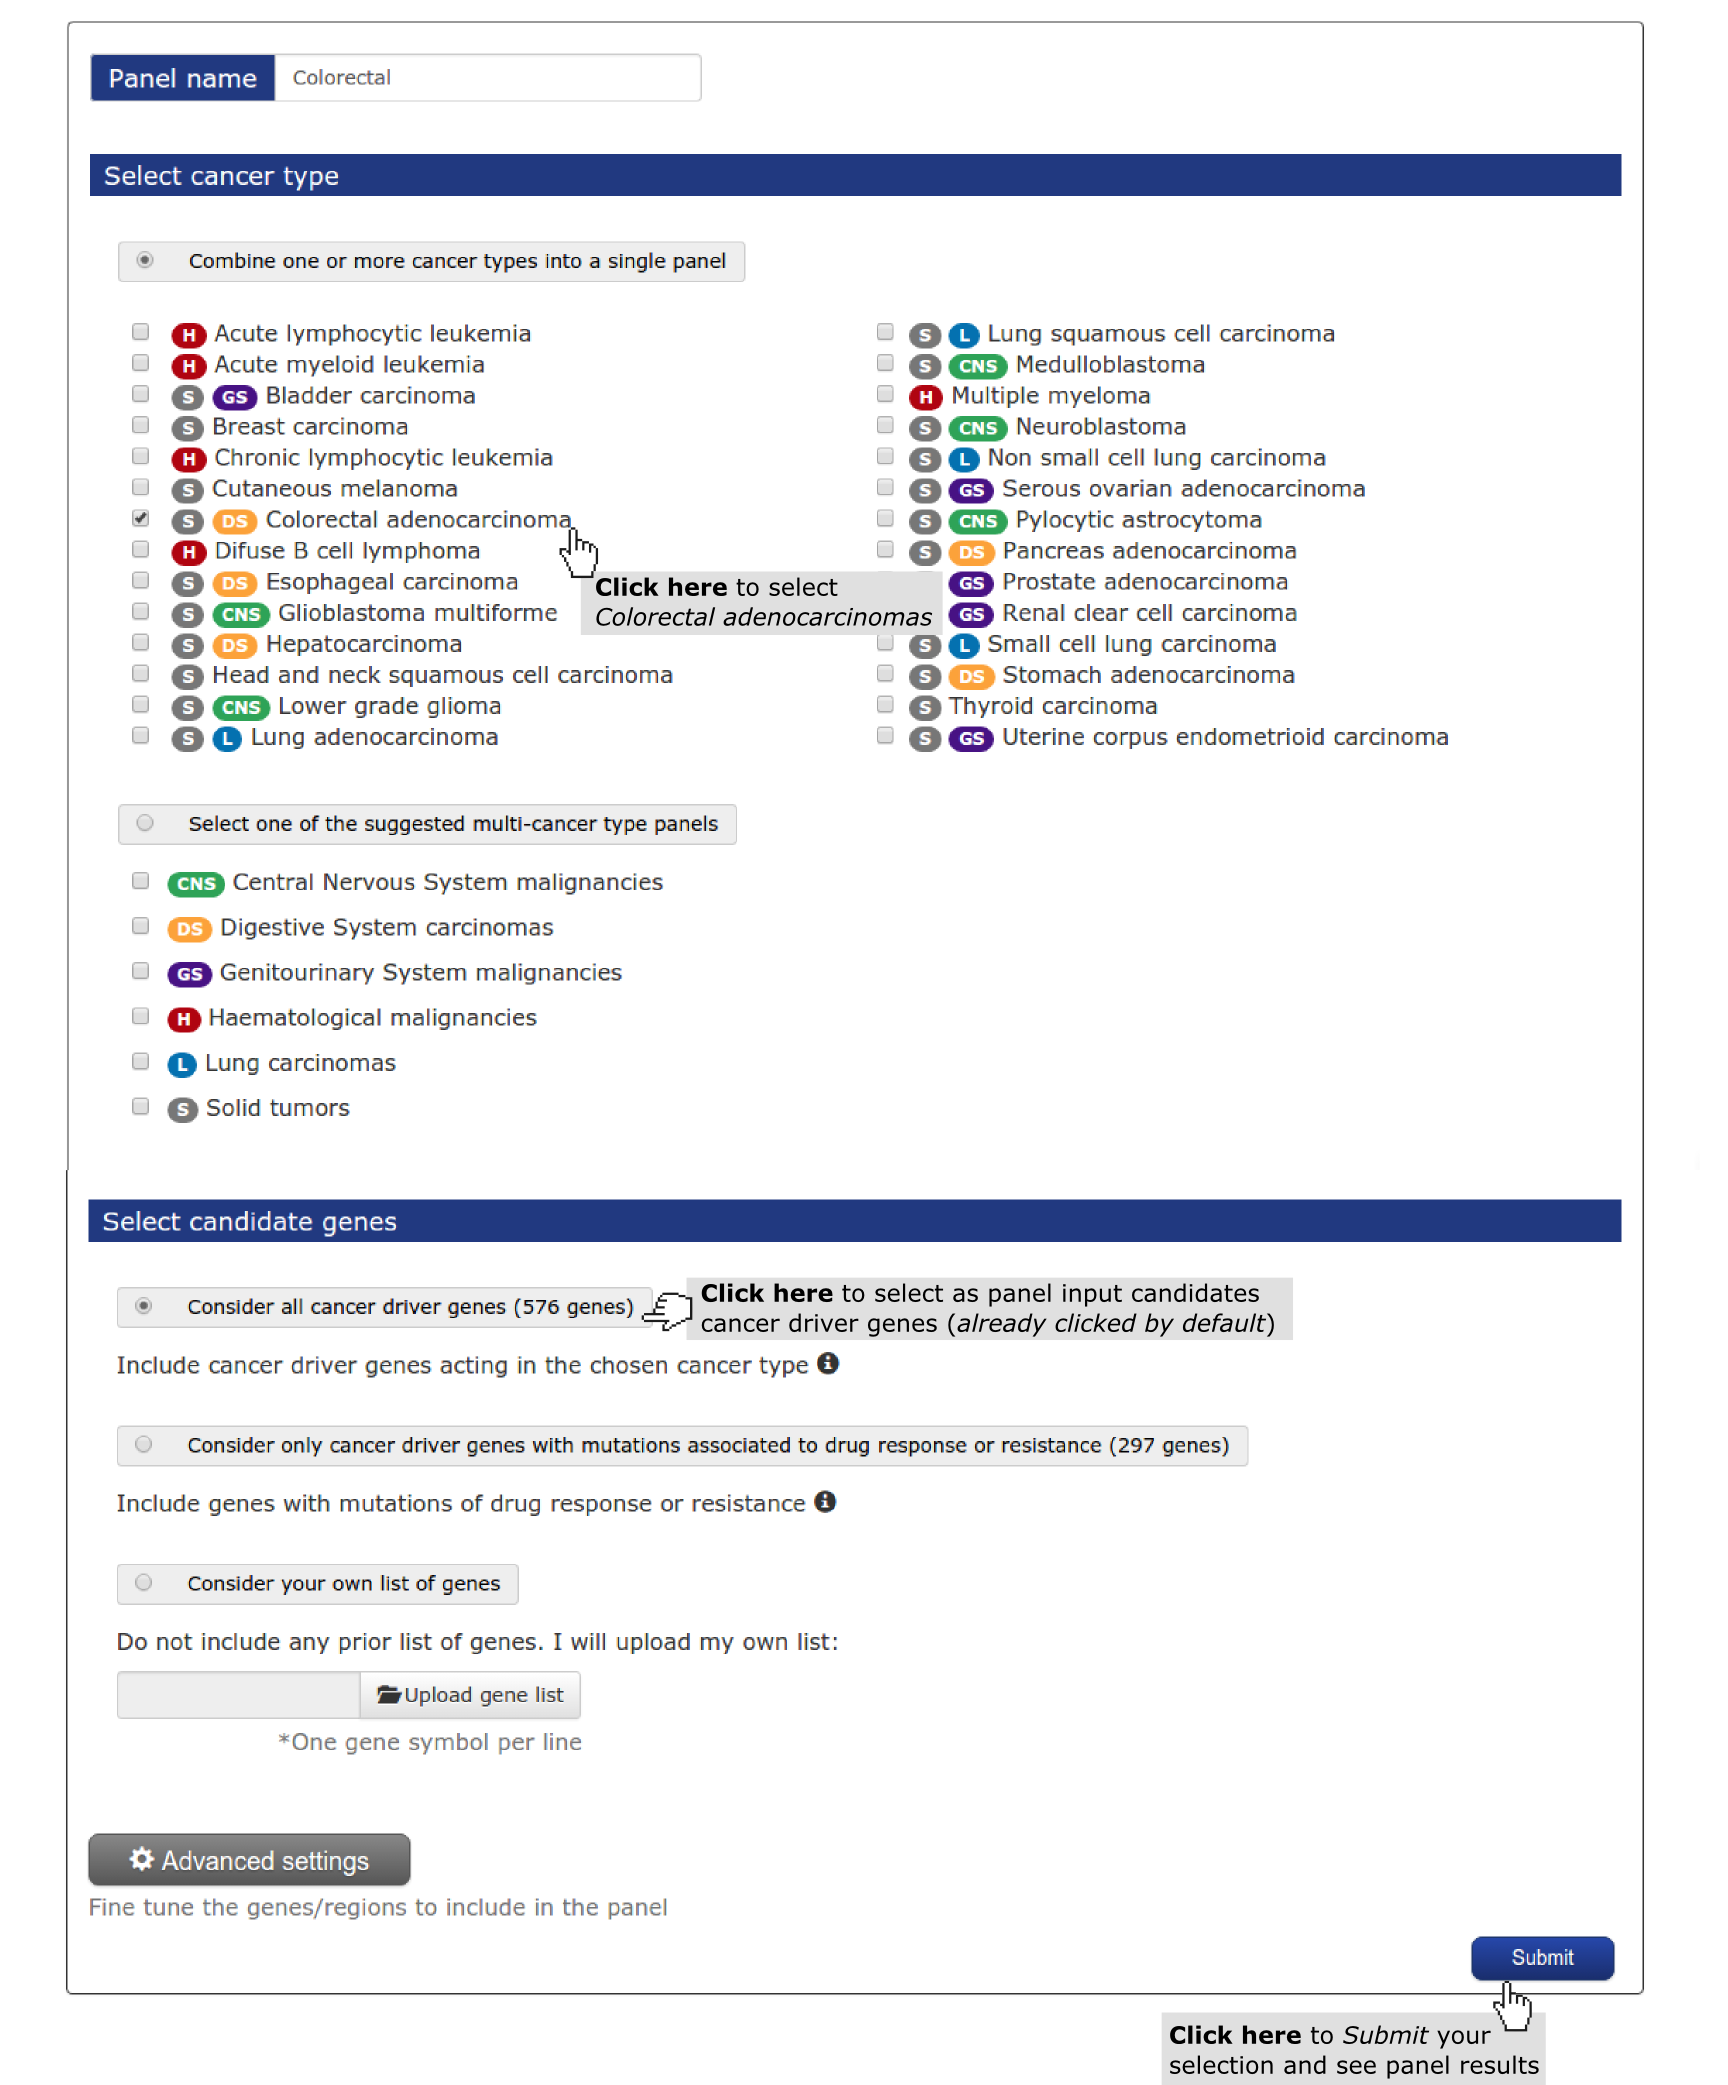
- Select a cancer type (mandatory). (See screenshot above) In this case study we have selected ‘colorectal adenocarcinoma’.
- Finally, select the list of genes to be included (in whole or their mutational hotspots) within the panel. By default is already selected considering all driver genes. This option guarantees the inclusion of genes driver tumorogenesis in colorectal adenocarcinomas. (See screenshot above)
2) The results
These are organised in a series of short reports characterizing the panel designed.
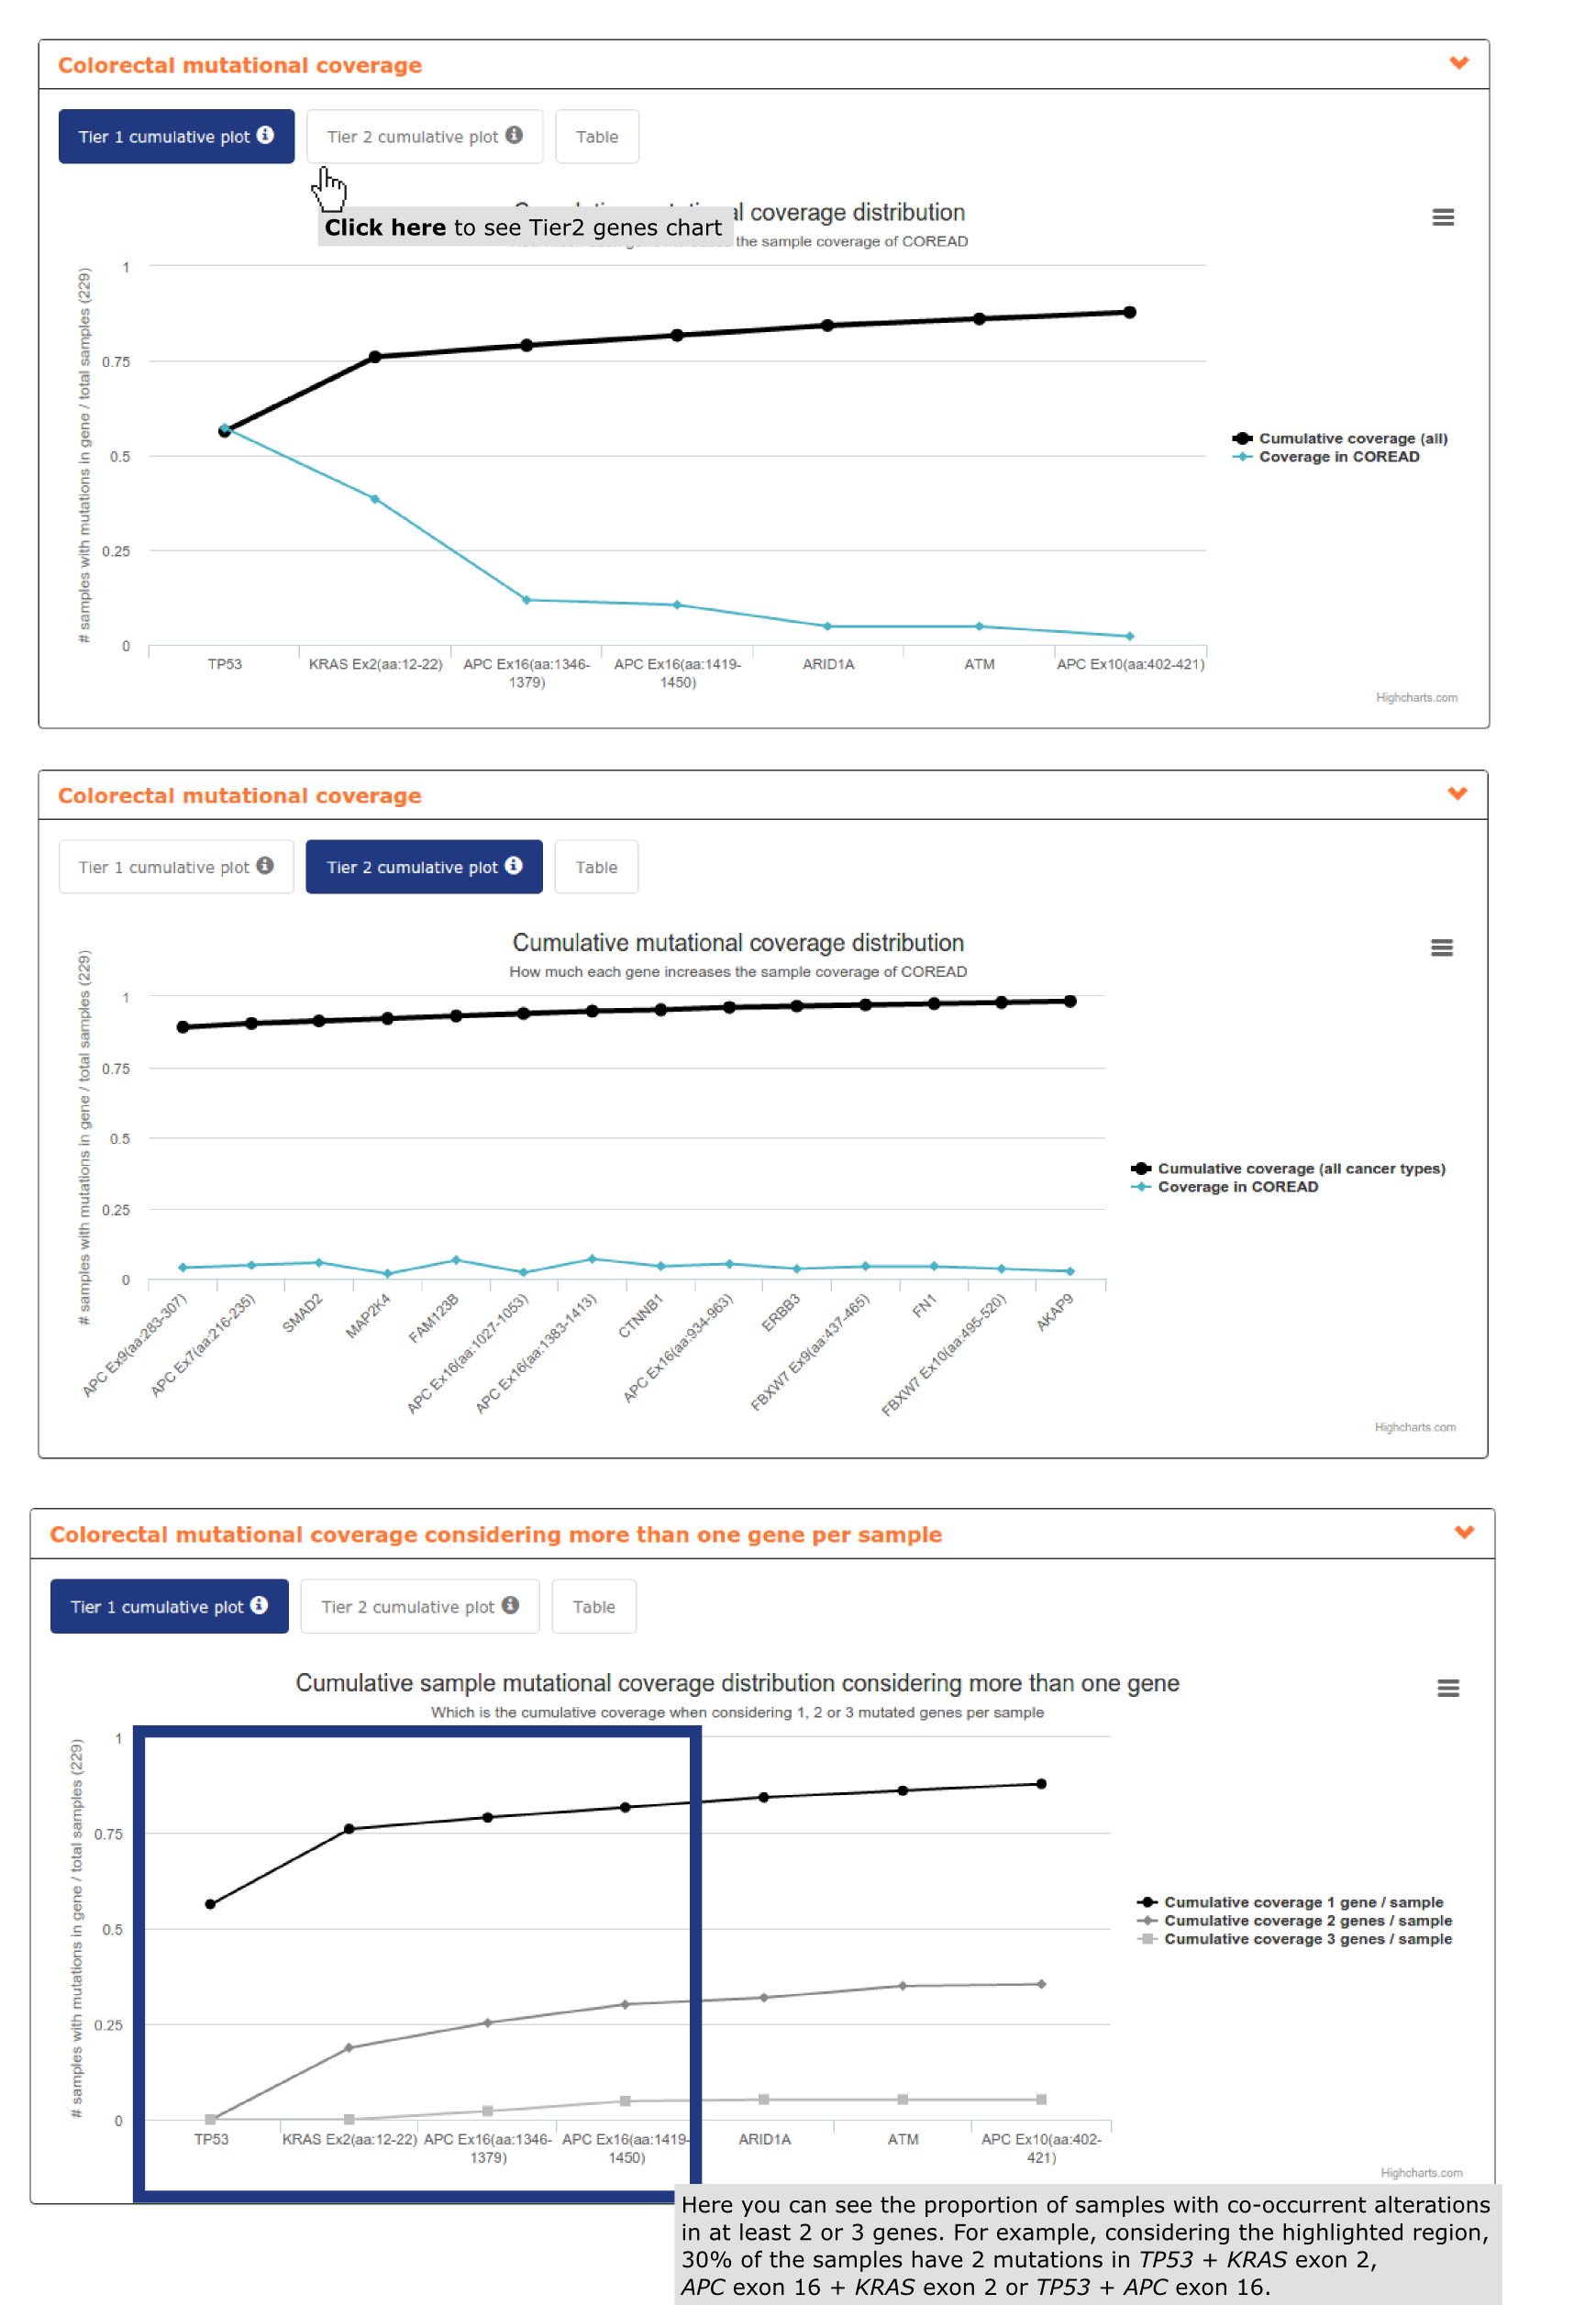
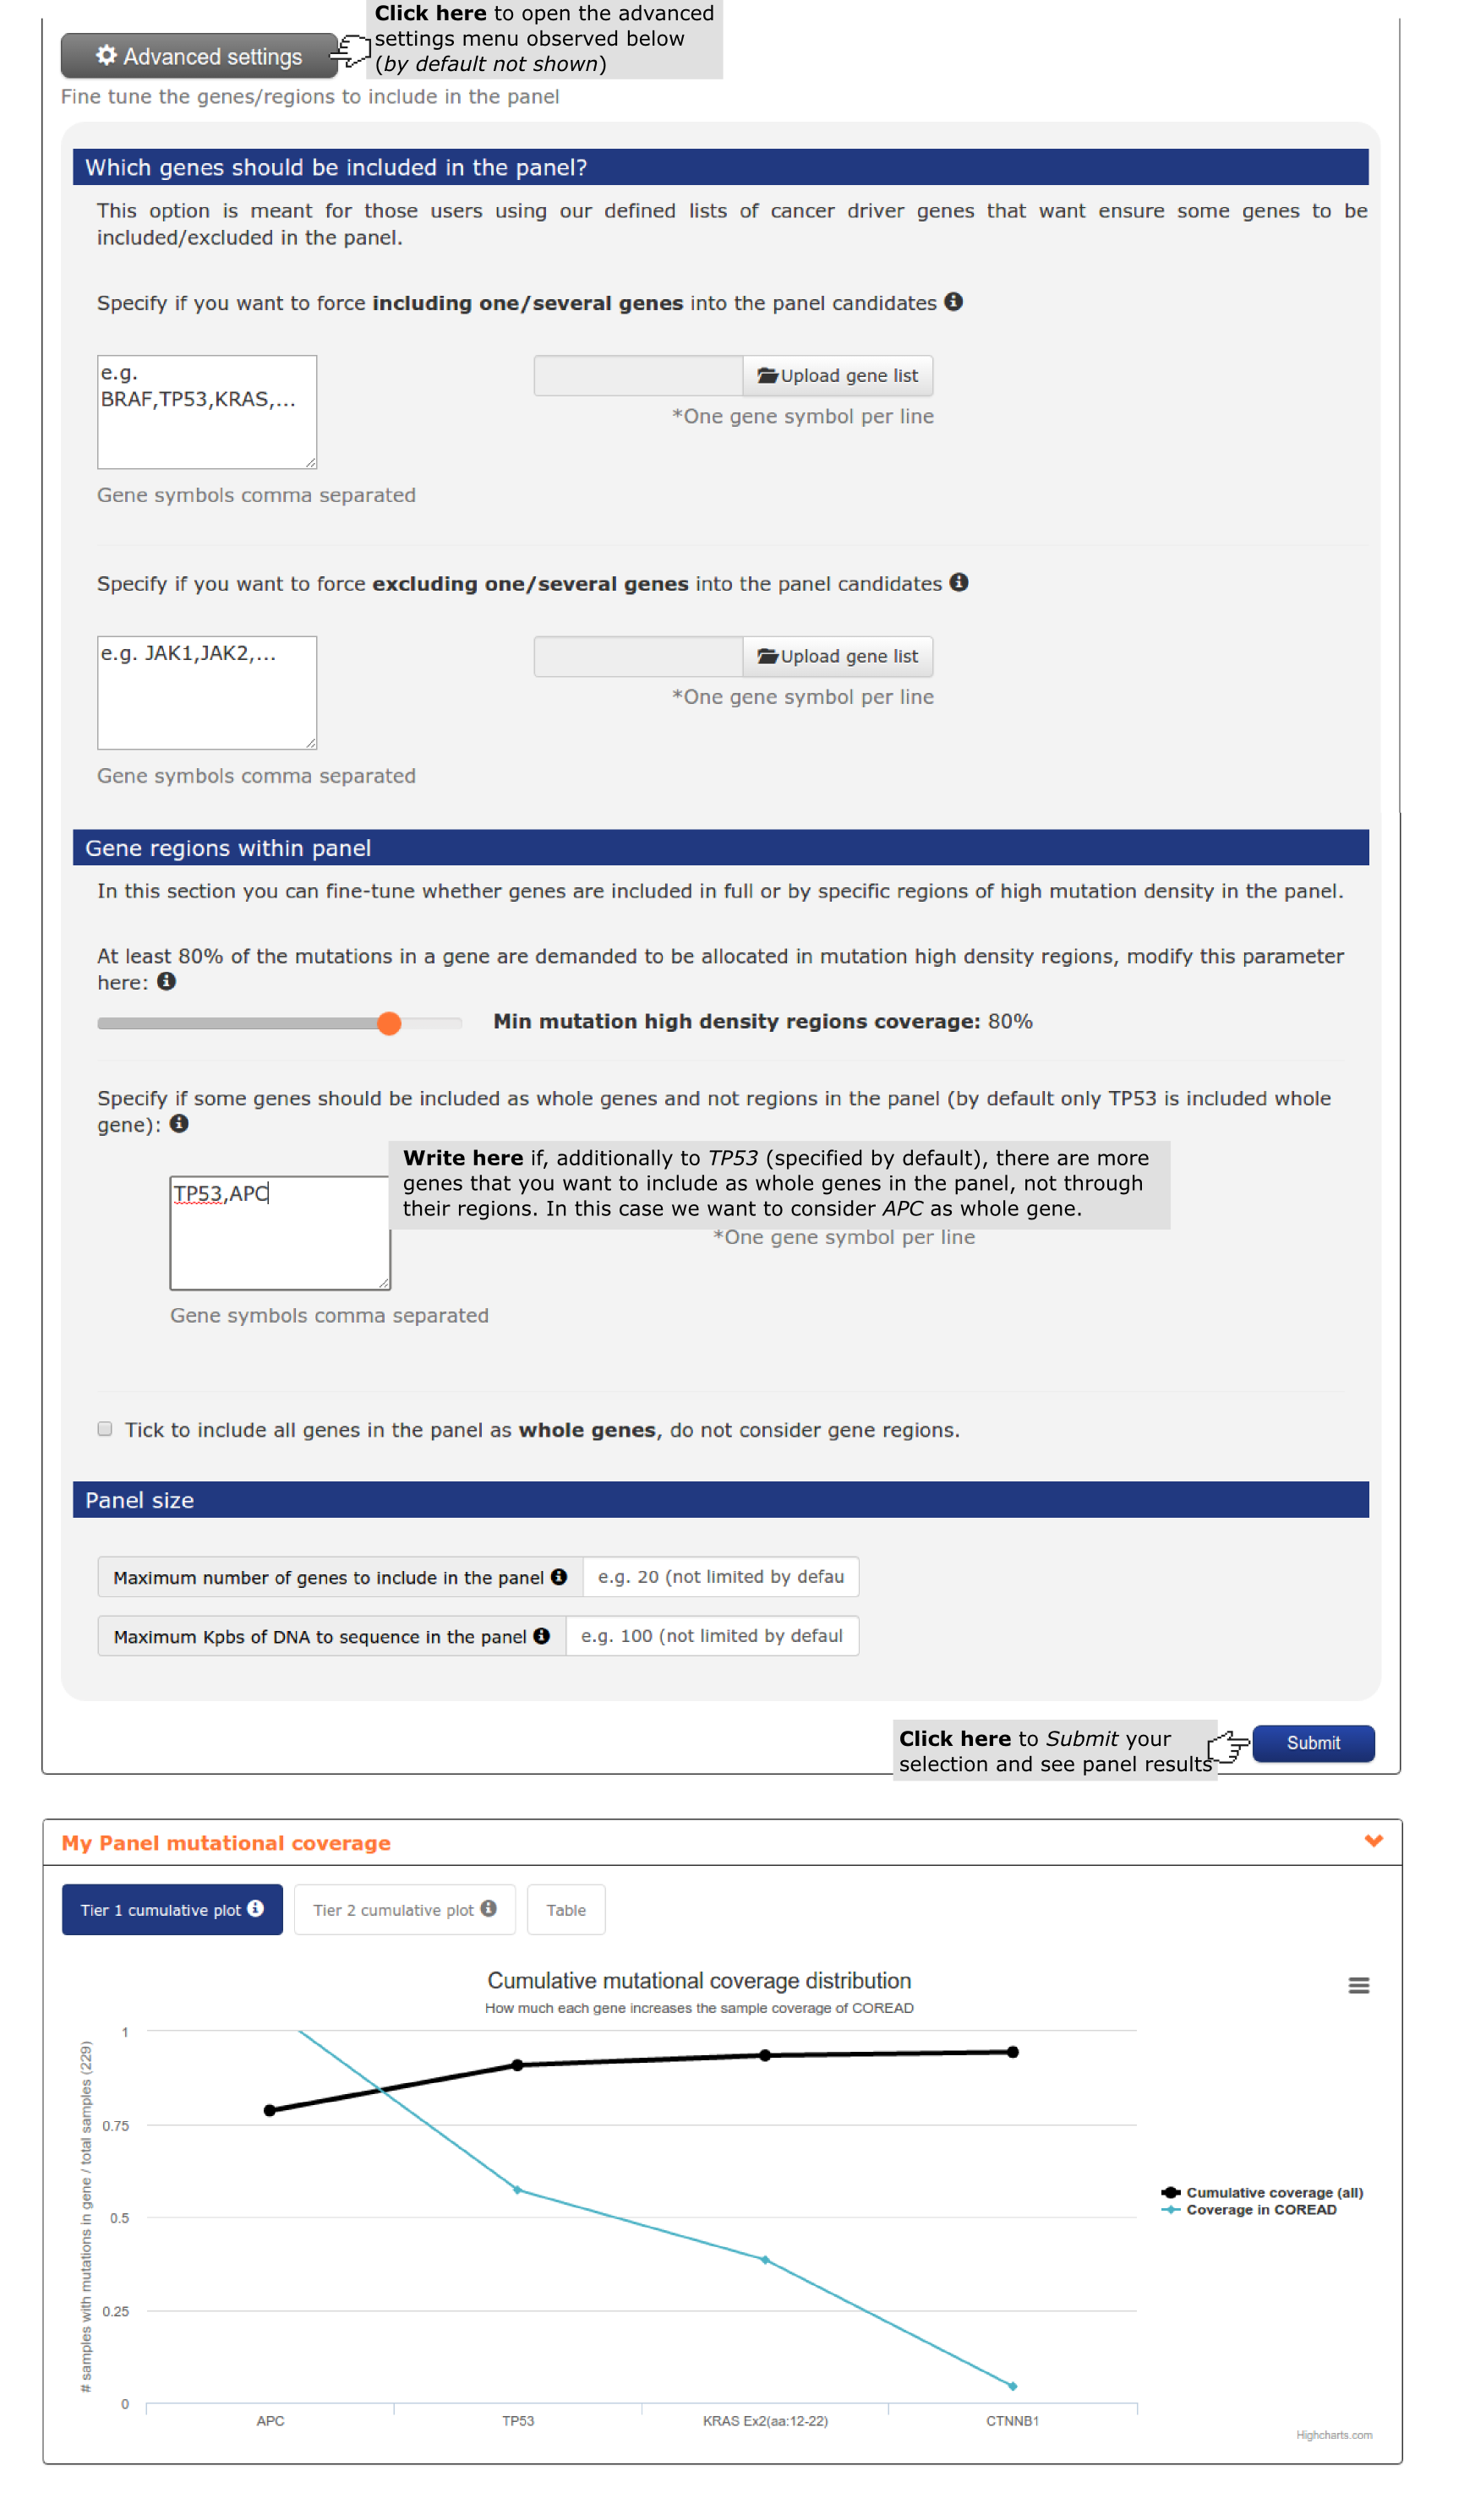
- The second report, or panel mutational coverage, contains a plot with the cumulative distribution of colorectal adenocarcinomas in the cohort with protein affecting mutations in at least one of Tier 1 (and Tier 2) genes. From this chart the user is able to identify that by considering only TP53, APC (3 regions), KRAS, ARID1A and ATM 87.% of the colorectal adenocarcinomas would be detected. Adding 6 more regions of APC, 4 whole genes and 2 gene regions (increasing Kbps to be sequenced from 17,492 to 25,045) 97.8% of the colorectal adenocarcinomas would be detected. The remaining 2.2% is not bearing alterations in driver genes (see screenshots below).
- The third report, or mutational coverage considering more than one gene per sample contains a graph analogous to the previous one, but tracking the cumulative fraction of samples with mutations in two or three genes of the panel. We can observe how 30% of the samples have co-ocurrent mutations in KRAS exon 2 + TP53, TP53 + APC exon 16 or KRAS exon 2 + APC exon 16 (see screenshot above).
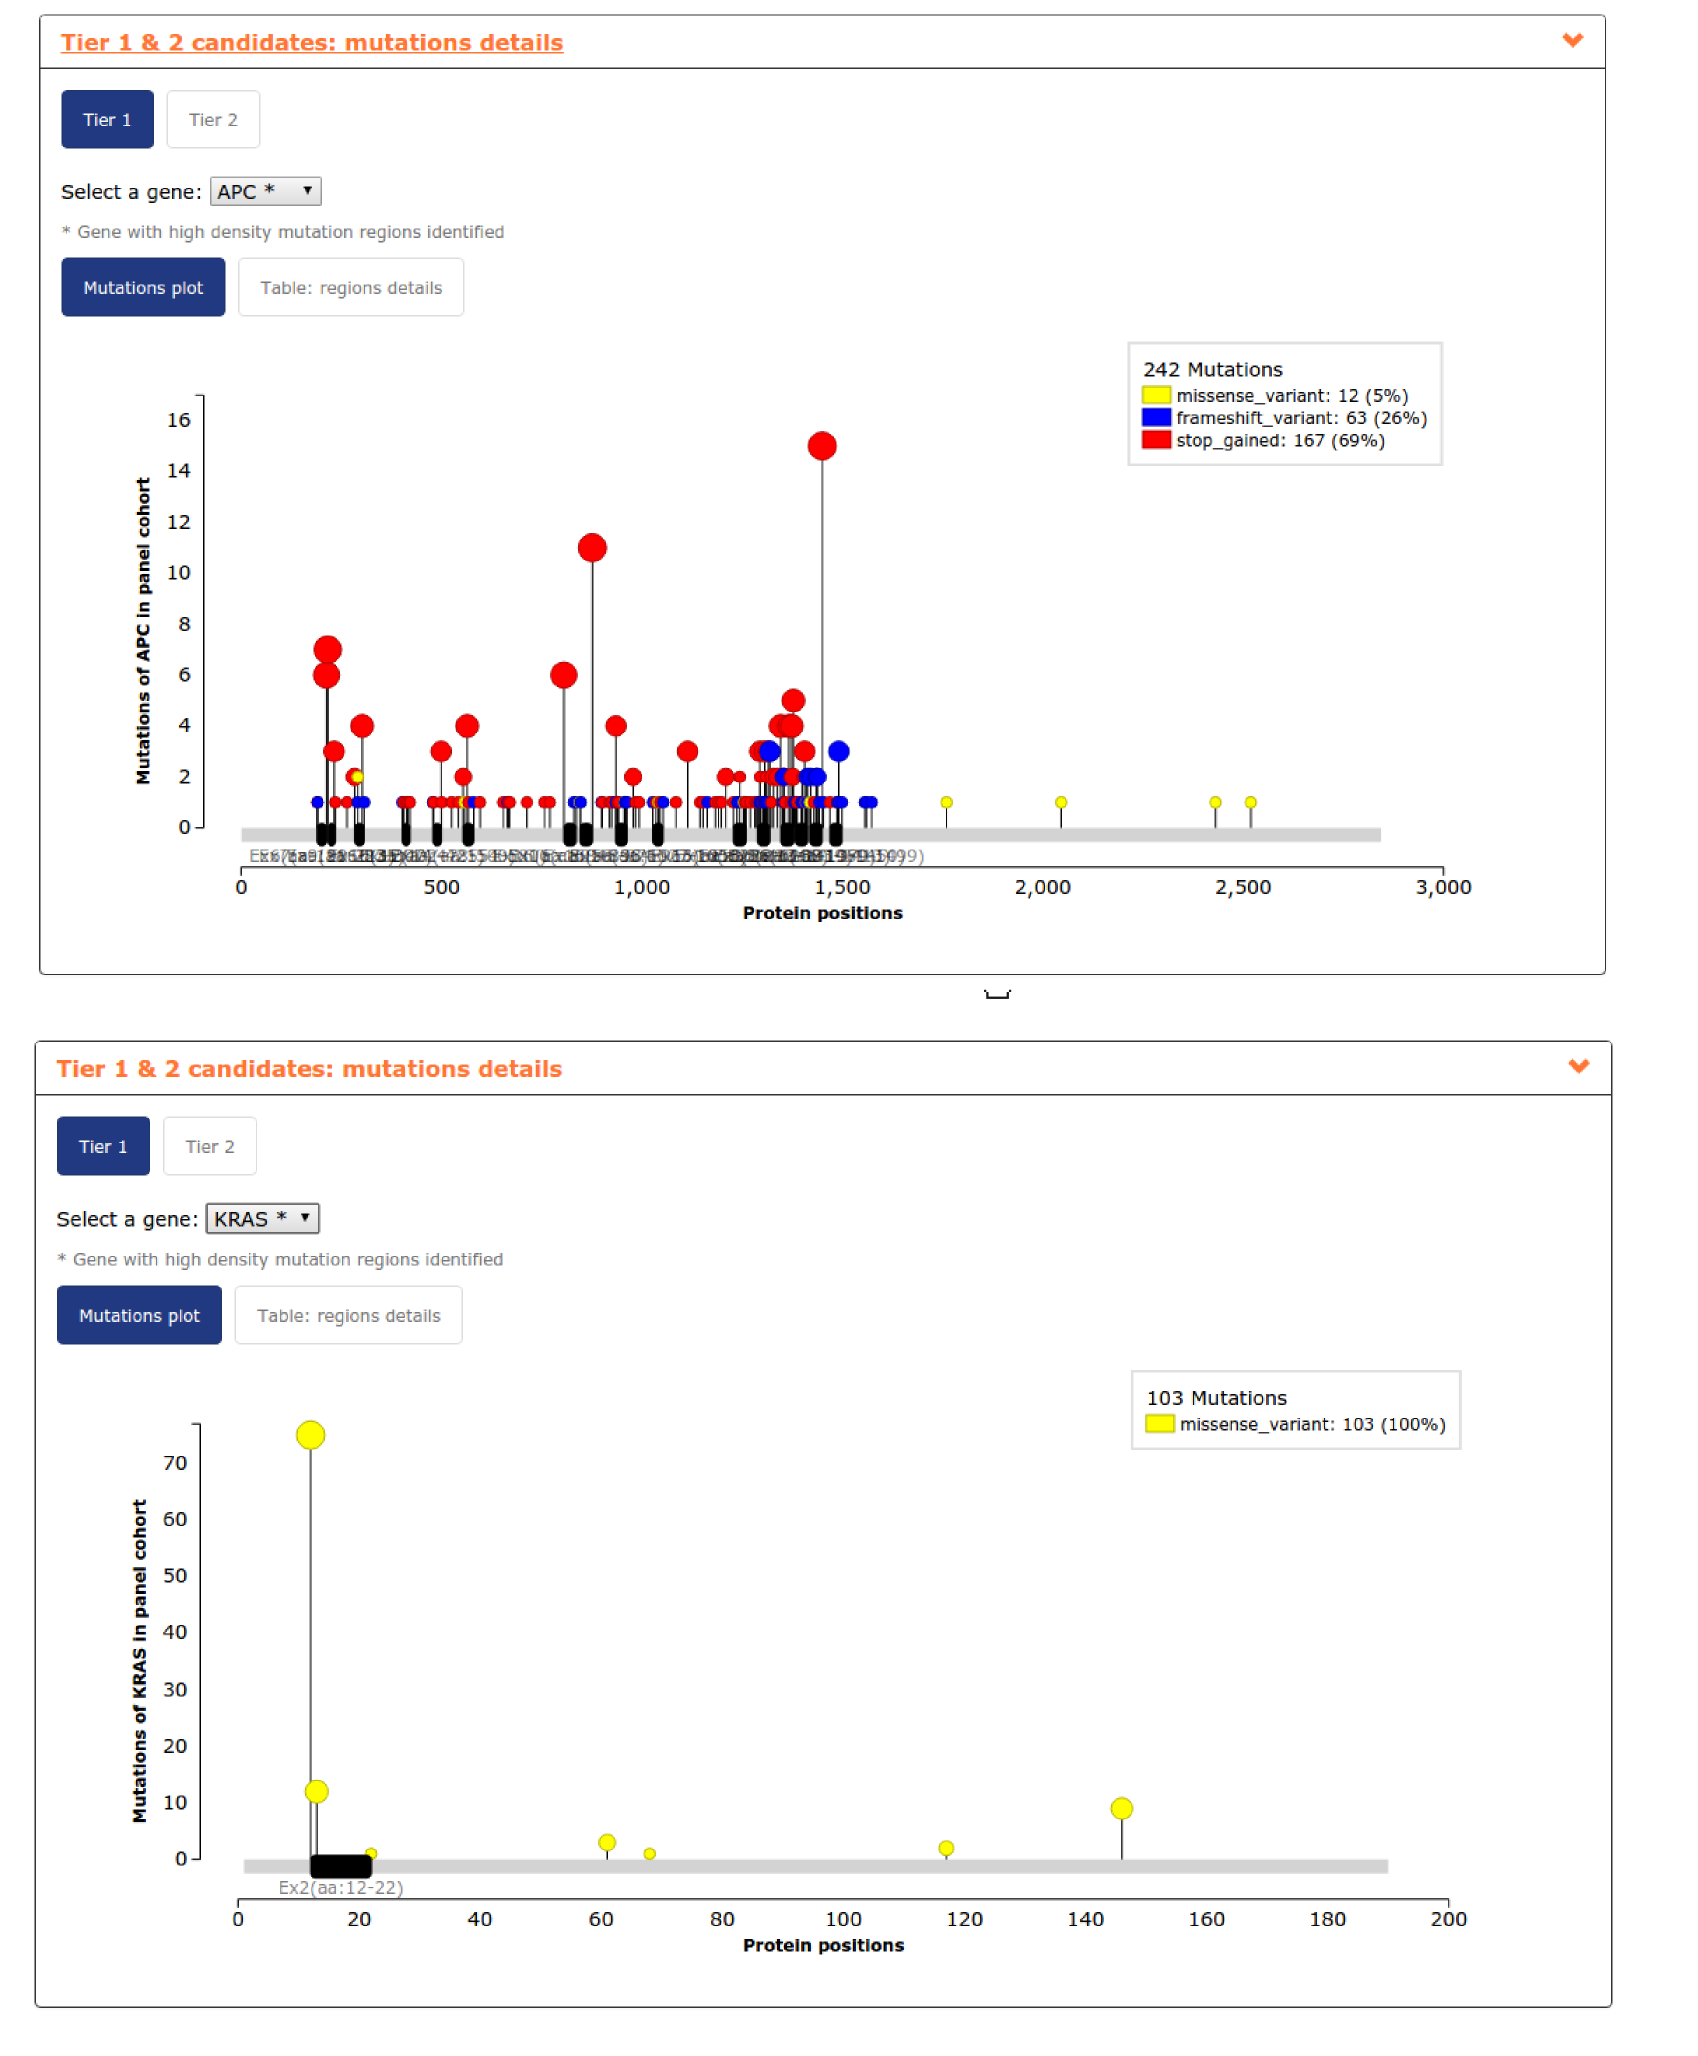
- The fourth report, or mutation details comprises a mutations needle plot1 with the distribution of mutations across the aminoacid sequence of each gene of the panel. Visualizing KRAS mutation needle plot user can easily see how region of exon 2 considered is enough to cover the highest proportion of proportion. However,in the case of APC, several regions are needed to cover the highest proportion of mutations in the gene (see screenshots for both genes below).In this case, where we include a lot of regions of a gene to maximize panel coverage, user may decide to repeat the panel and considering not only TP53 as whole gene (the only gene considered by default) but also APC. See below the screenshots of the mutational coverage chart for a colorectal adenocarcinoma panel considering APC as whole gene and how to do it by going into the Advanced settings of panel design. In this case ARID1A and ATM jump to Tier 2 samples with mutations in both genes tend to have also mutations in APC.
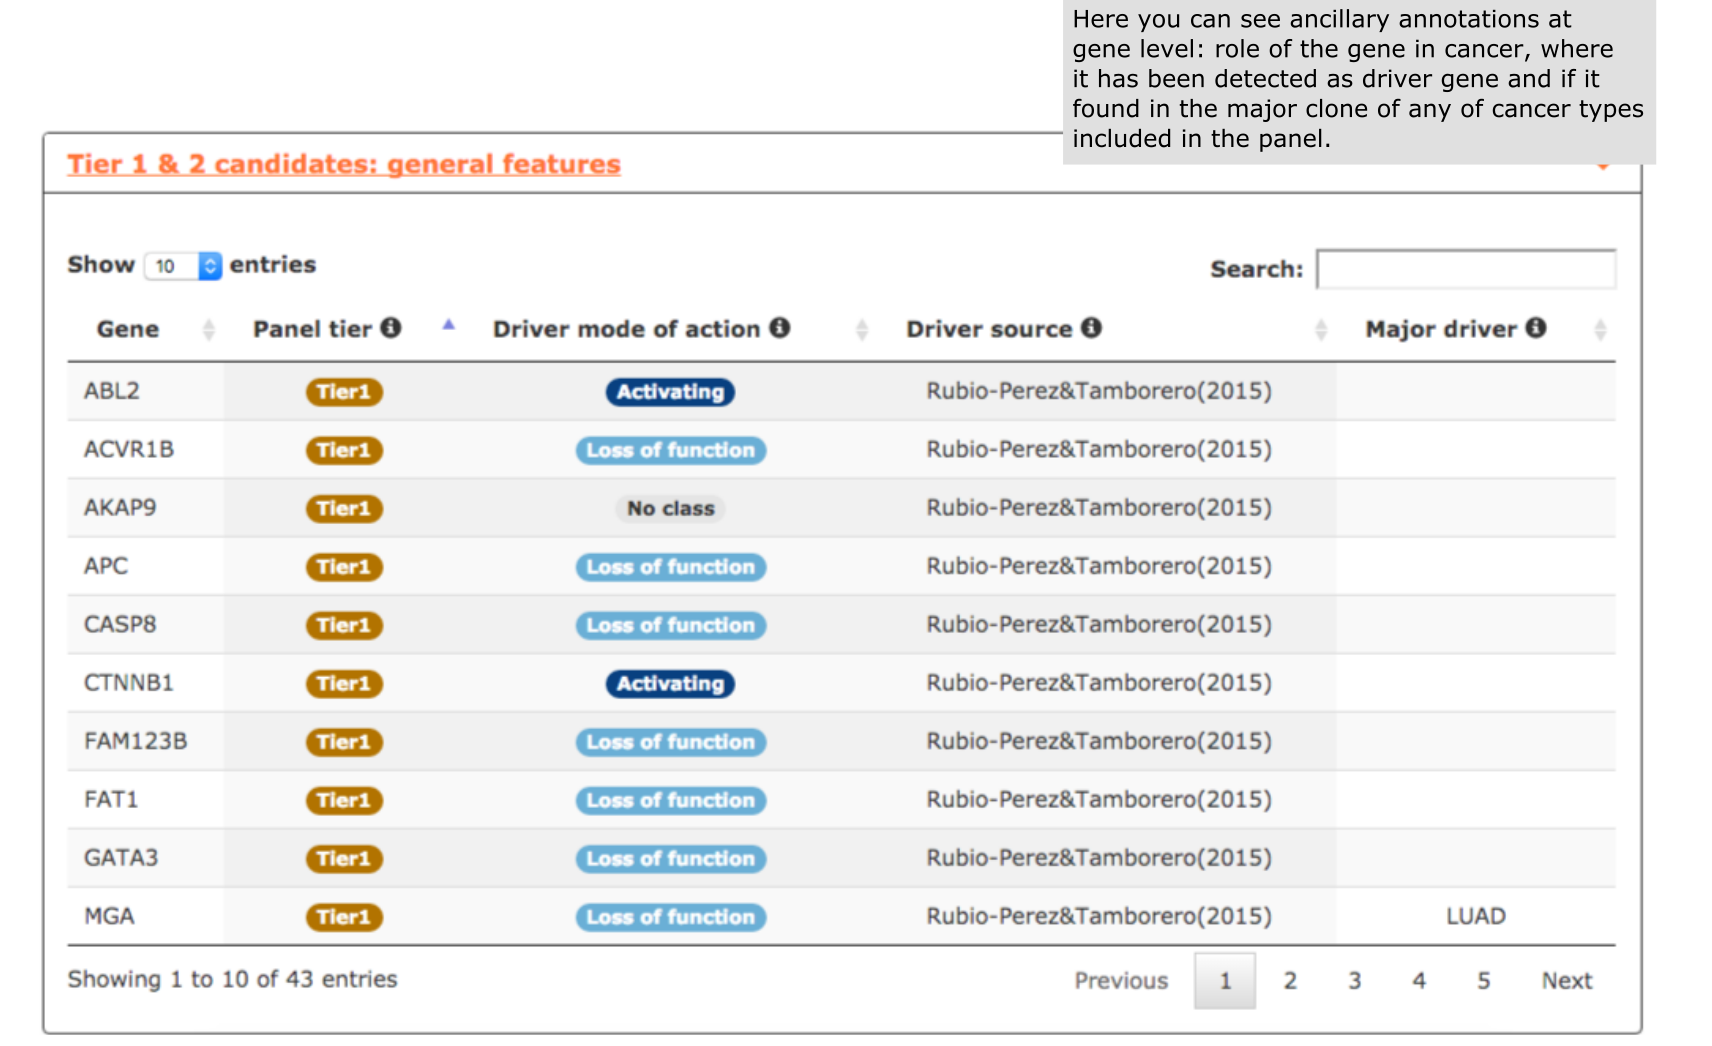
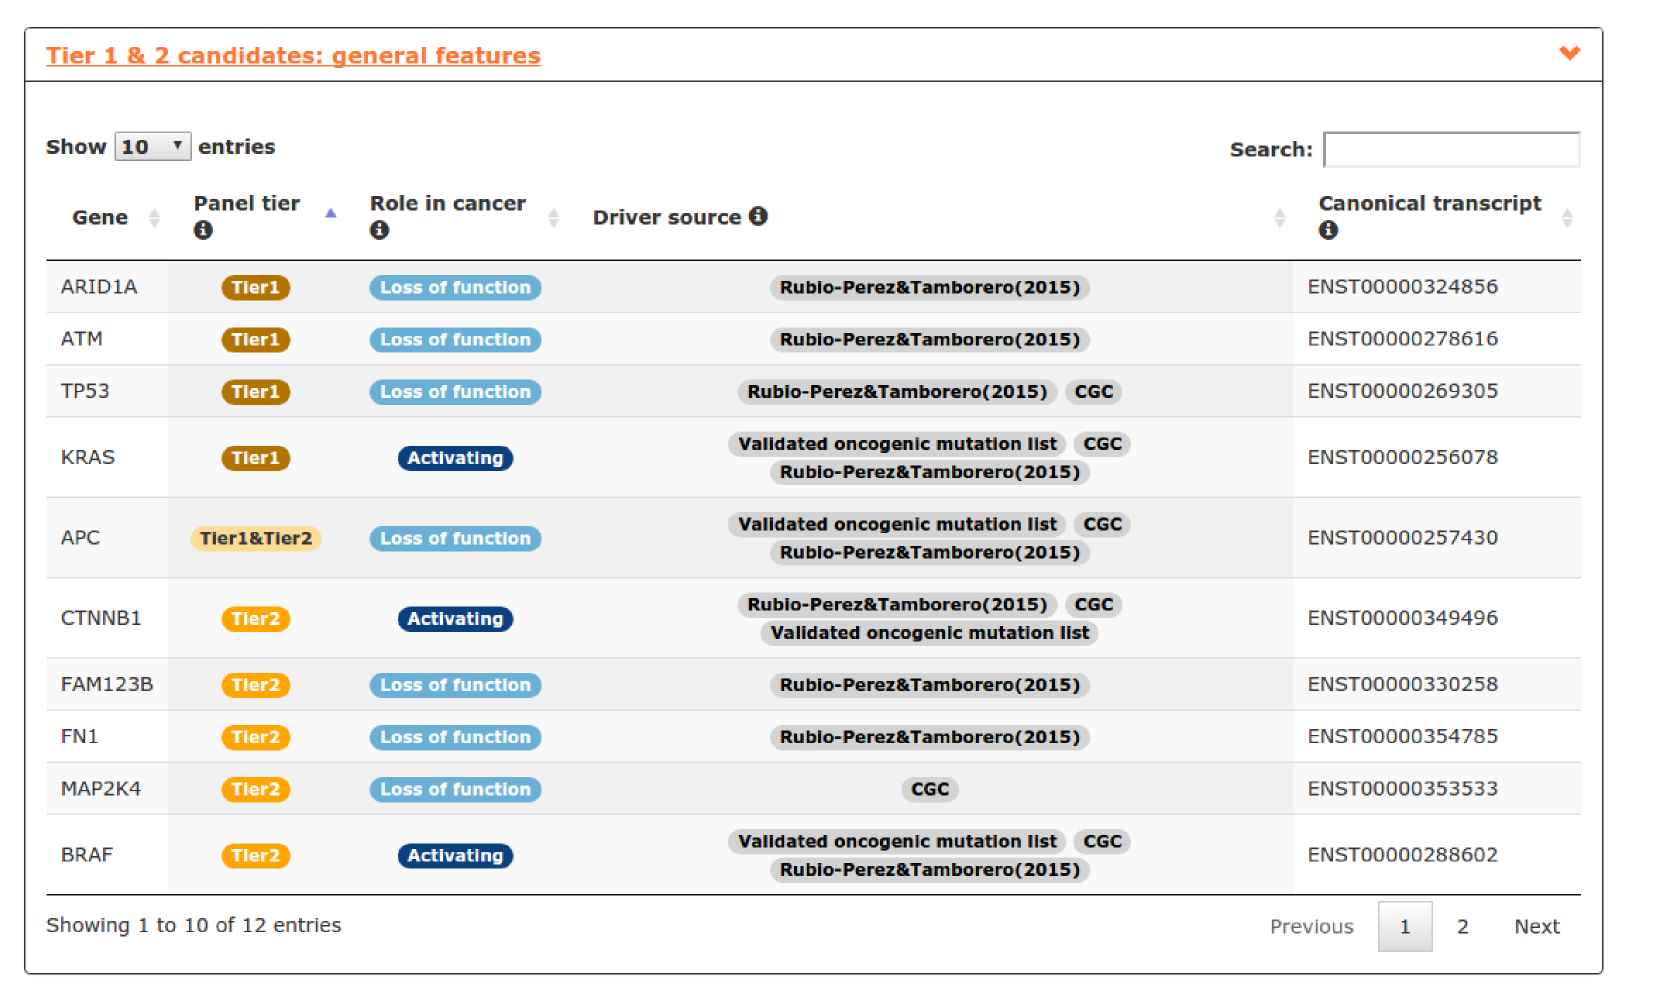
- The fifth report, or general features, contains annotations to further characterize the candidates included in the panel. For example, we can explore the role of genes in cancer, useful for not very well known genes like in this case CTNNB1, FAM123B or FN1 (see screenshot below).
Here, we describe step-by-step the use of OncoPaD to design a panel aimed at stratifying lung carcinomas for their potential response to anti-cancer drugs through the sequencing of circulating free or tumor cells DNA. To this end, we want to design a panel based on the list of genes containing biomarkers of sensitivity/resistance to drugs.
1) The input
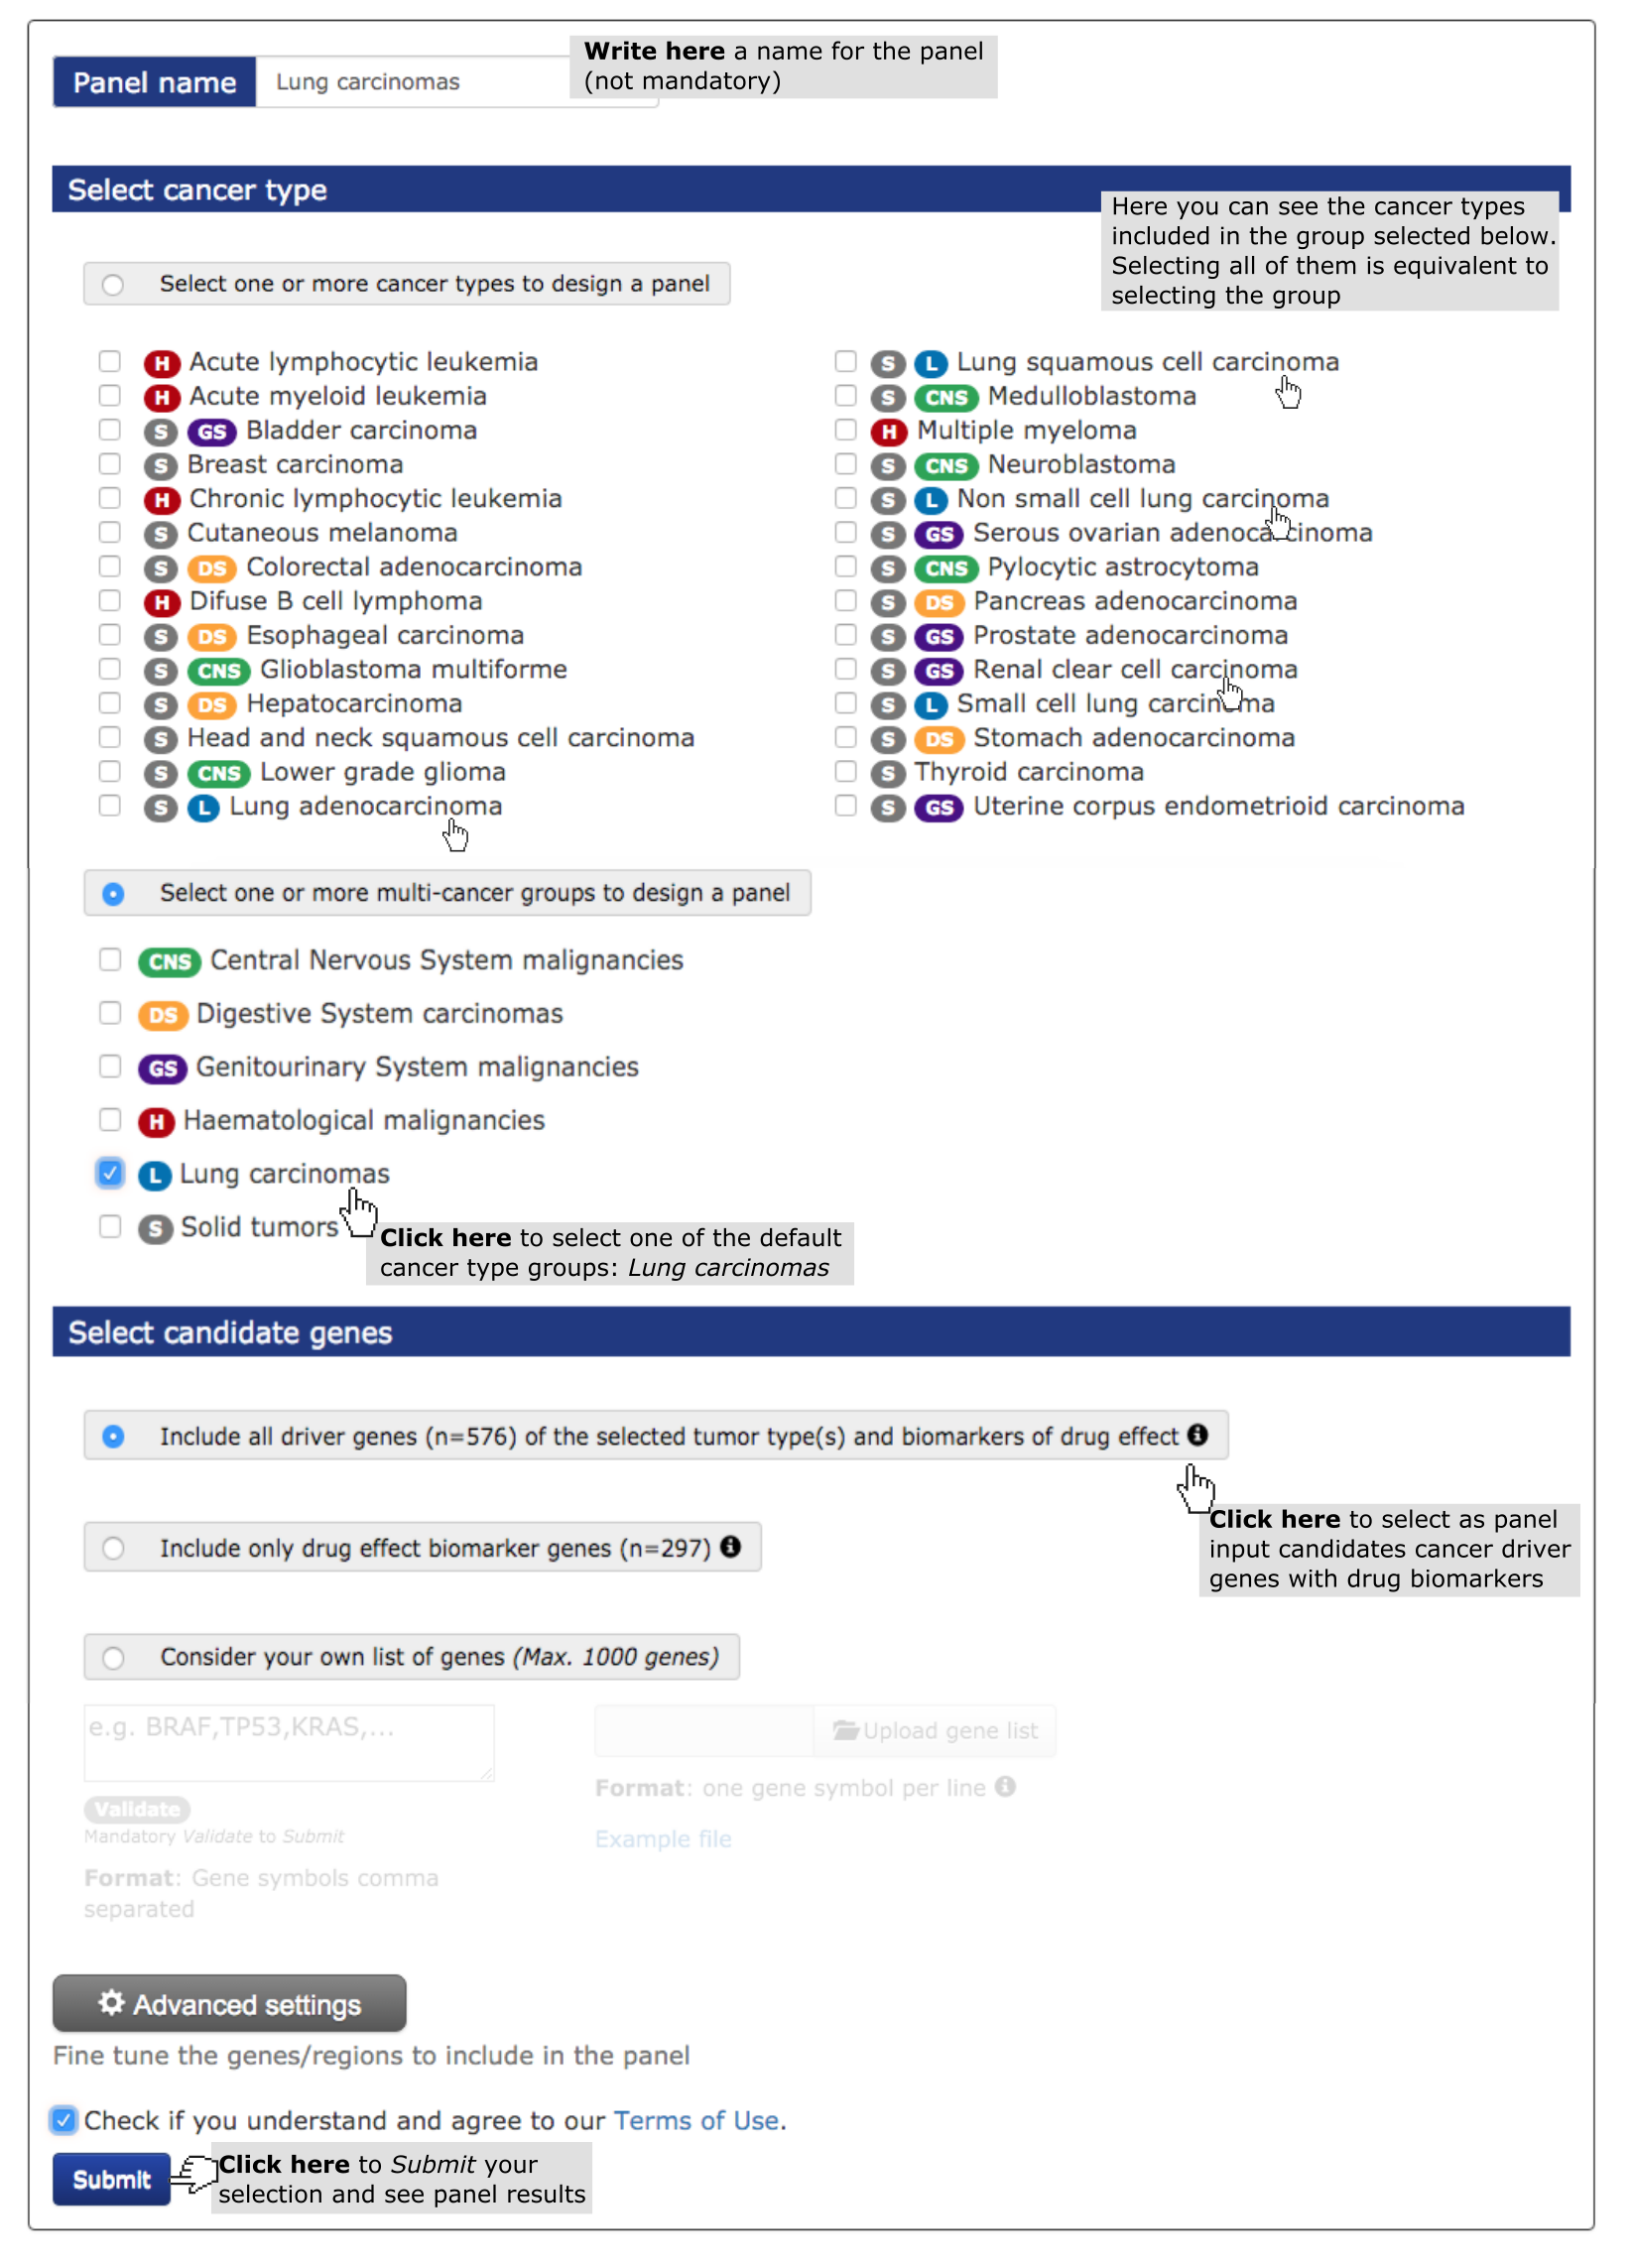
- Select a name for the panel (My panel is the default if no name is given).
- Select a cancer type (mandatory). (See screenshot below) In this case study we have selected ‘lung carcinomas’, one of the pre-assembled pan-cancer tumor types at the user’s disposal.
- Finally, select the list of genes to be included (in whole or their mutational hotspots) within the panel. Select the second pre-compiled list (screenshot below). This option guarantees the inclusion of mutations influencing drug response which occur in genes that drive lung carcinomas. For example, EGFR will be included, since the mutation EGFR L858R is known to confer sensitivity to EGFR inhibitors. On the other hand, KEAP1 will not be included in the panel, despite being a lung cancer driver, as its mutations are not known to influence the effect of any drug.
The Advanced settings provides access to an assortment of options to fine-tune the design of the panel. For example, the user may exclude EGFR from the panel if they are interested in studying genes mutated at lower frequencies. In this case study we will consider all possible driver genes with mutations associated to a drug effect by immediately clicking on the Submit button to design the panel.
2) The results
These are organised in a series of short reports characterizing the panel designed.
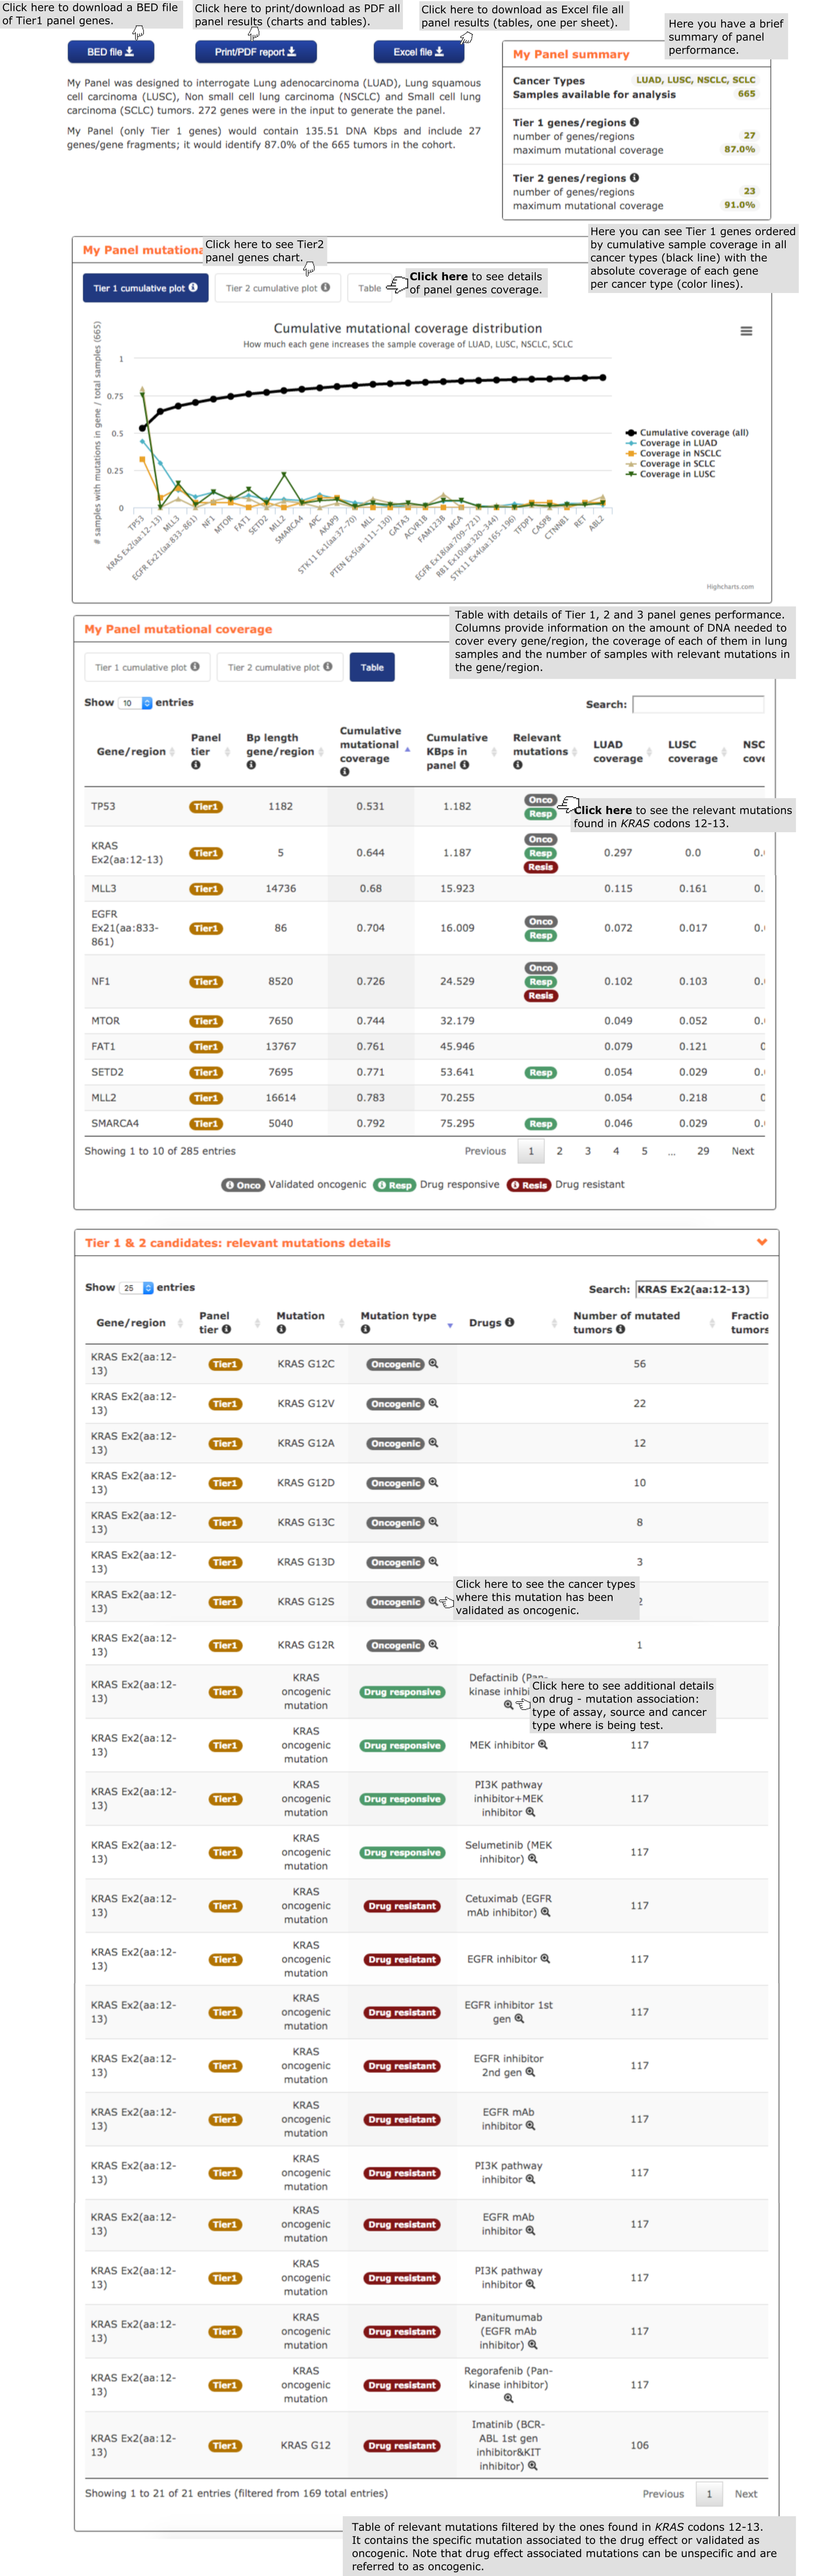
- First, the user finds a brief summary on the performance of the composition of the panel and its performance on the cohort of lung carcinomas, as well as buttons to download the panel as a PDF report with all charts and tables or a BED file with Tier 1 panel genes.
- The second report, or panel mutational coverage, contains a plot with the cumulative distribution of lung carcinomas in the cohort with protein affecting mutations in at least one of Tier 1 (and Tier 2) genes. From this chart the user is able to quickly identify the most frequently mutated amongst Tier 1 genes in the cohort of lung tumors considered (665). For example, a panel including the first 4 genes and 2 regions in the graph (from TP53 to MTOR) would detect 75% of the samples. The plot may be readily transformed into a Table containing further information on all mutations within the cohort by clicking on the ‘Table box’ on top of the chart. For example, one may see the exact coverage obtained by sequencing each incremental array of the genes in the graph, and the amount of DNA to sequence in each case. The table also informs the user whether mutations in genes in the panel found in the cohort are associated to a drug effect (‘Relevant mutations column’) in lung carcinoma samples and how many samples would bear these mutations. Note that although the user has included in the design of the panel all driver genes with mutations associated to a drug effect, the particular mutation may have been found relevant in a cancer type different than that of the panel (e.g. MLL3, MTOR, …). By clicking on the tags counting the number of samples with relevant mutations (see example in the screenshot below with mutations in KRAS codons 12-13 which confer drug sensitivity) the user is redirected to the relevant mutations details report (see below)
- The third report, or mutational coverage considering more than one gene per sample contains a graph analogous to the previous one, but tracking the cumulative fraction of samples with mutations in two or three genes of the panel.
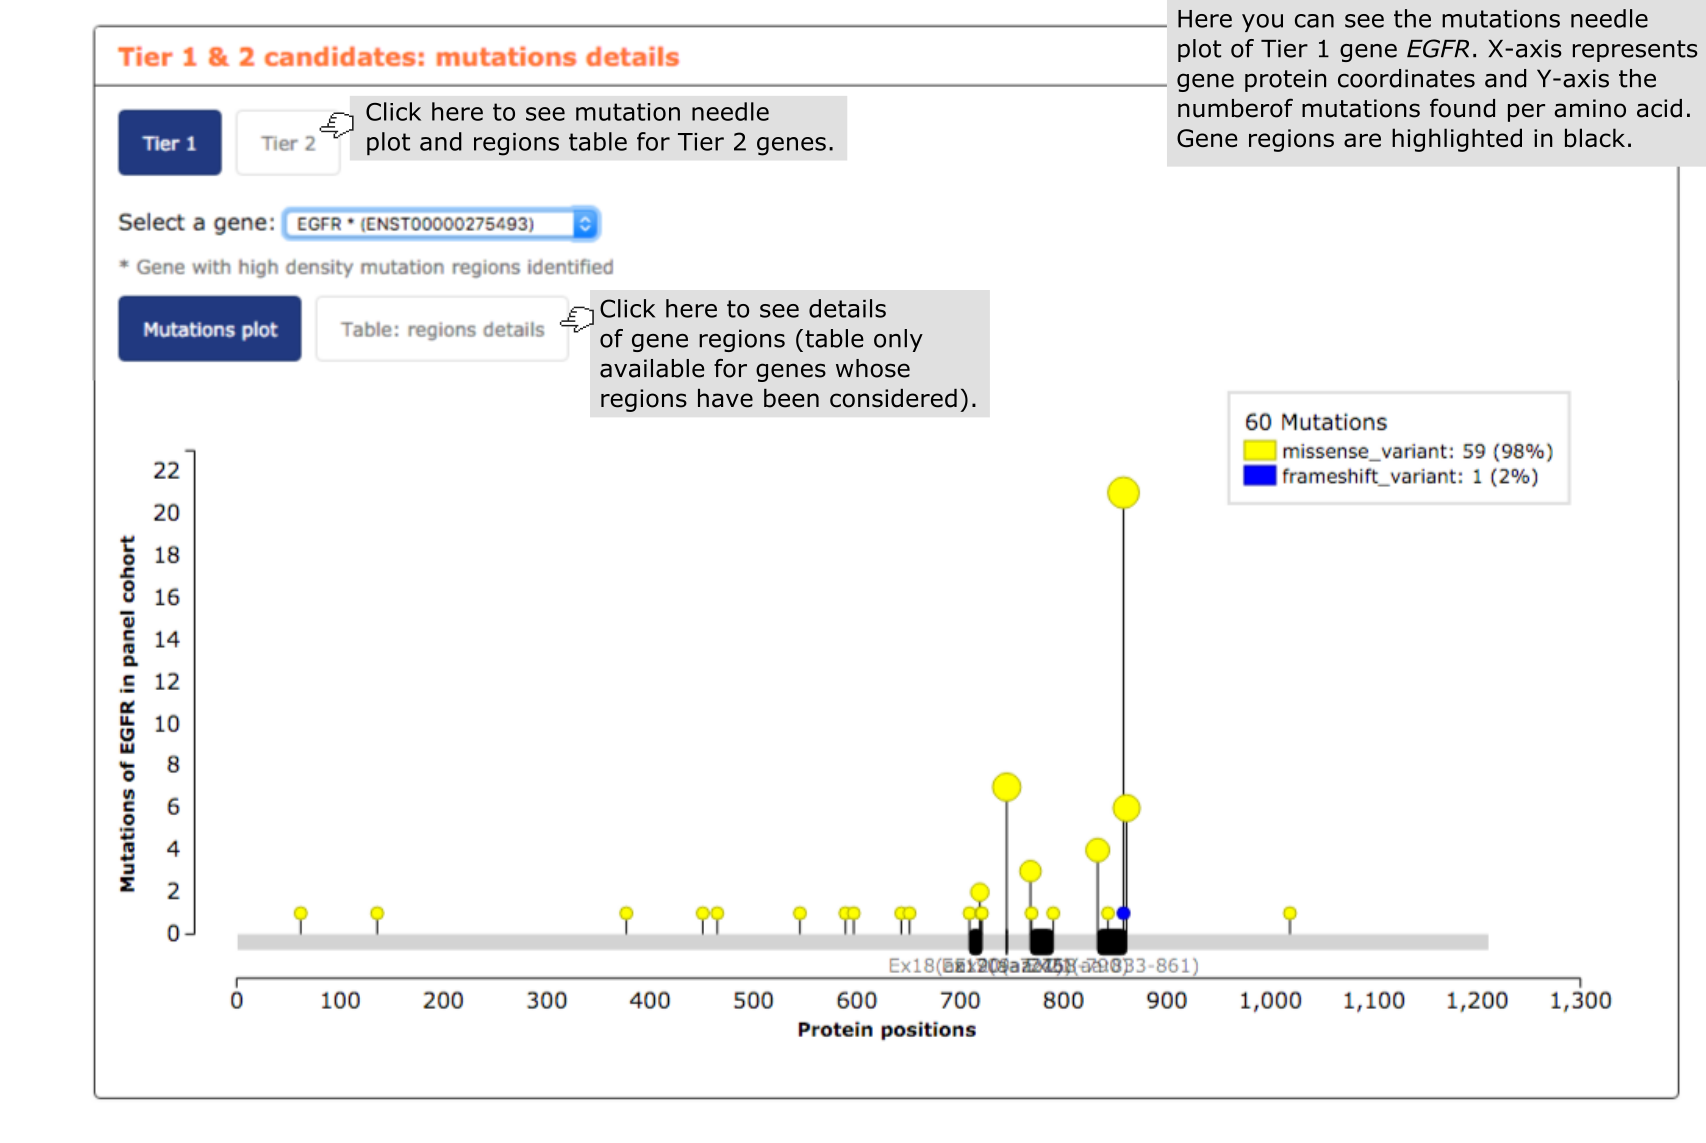
- The fourth report, or mutation details comprises a mutations needle plot1 with the distribution of mutations across the aminoacid sequence of each gene of the panel. In the case of genes that have been broken down into mutational hotspots to include them in the panel, all regions identified in the gene are highlighted in black below the plot. The user has also the possibility of going to ‘Table:regions details box’ and see further information on gene regions, such as the proportion of mutations in the region and their genomic coordinates. See below an exemplary screenshot of the distribution of mutations in lung carcinomas across the sequence of EGFR. Most mutations in lung carcinomas are concentrated in just 3 short stretches, specifically encompassing 86, 67, 37 base pairs, respectively (this latter information can be obtained by clicking on the ‘Table:regions details’ box.
- Next, the user finds the relevant mutations details report, containing details of the mutations found within each element (gene or region) in the panel. The user finds, for instance, the exact protein coordinates of the mutation, its frequency in the cohort, and ancillary information on their involvement in oncogenesis or their role as biomarkers of response to drugs.
- The last report, or general features, contains annotations on all Tier 1 and Tier 2 genes, such as their role in cancer (activating or loss of function), the original source reporting their involvement in tumorigenesis, and the cancer type where the gene showed a tendency towards being clonal.